Monitoring Development Guide
Feature Introduction
Monitoring system is a set of tools for real-time monitoring, collecting and analyzing various resources and application running states in cluster. It can provide detailed performance metrics about nodes, containers, applications and networks, helping understand overall health status of cluster. Meanwhile, monitoring system can be adjusted and extended according to different business needs to adapt to constantly changing environments and requirements.
- High availability and system stability: By monitoring various metrics in cluster in real time, can ensure system can respond and handle quickly when problems occur, avoiding system crash caused by single point failure or resource shortage.
- Proactively identify and resolve potential problems: Through continuous data collection and analysis, monitoring system can identify potential performance bottlenecks and failure points, provide early warnings and take measures, thereby avoiding problem escalation.
- Flexibility and scalability: Cluster environments usually have high dynamics and complexity. Monitoring system needs to adapt to these changes, be able to automatically discover and monitor newly deployed services and applications, while support extension according to needs. For details, please refer to Monitoring User Guide.
Constraints and Limitations
None.
Environment Preparation
Monitoring system is installed and deployed together with platform. For detailed installation steps, please refer to Installation Guide.
Task Scenarios
This chapter introduces developers deploying their own collectors and configuring Servicemonitor to collect data.
Task Scenario Overview
Developers need to deploy custom data collectors (Exporter) in Kubernetes environment, and enable Prometheus to discover and collect these monitoring data by configuring Servicemonitor. Specific tasks include deploying Exporter, creating and applying Servicemonitor, and verification. Final goal is to ensure Prometheus can correctly collect collector data.
System Architecture
Monitoring system is divided into UI layer, backend layer, and component layer according to business hierarchy. System architecture is shown in following figure.
Figure 1 Monitoring System Architecture
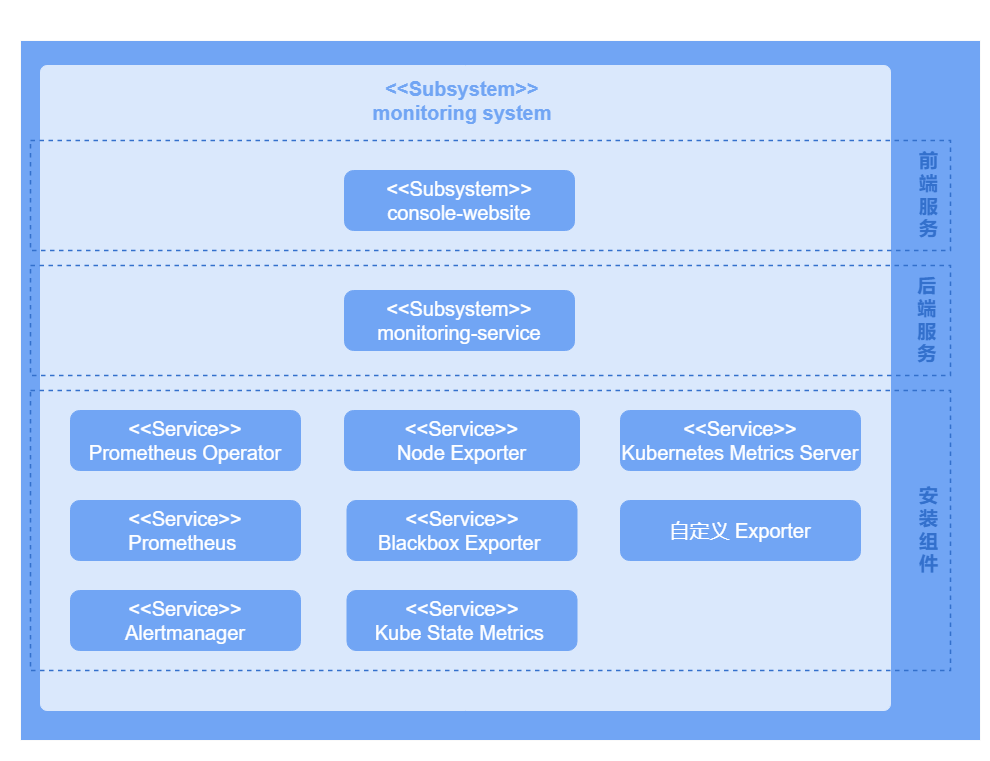
UI layer
Users can perform monitoring operations on console-website.
Backend layer
monitoring-service is deployed in microservice form providing some core capabilities, including metric querying, monitoring target configuration and alerting rule configuration.
Component layer
Component layer mainly provides key data support for monitoring layer. Monitor different targets, collect various metric indicators about entire cluster system to facilitate subsequent querying, analysis and alerting.
Development Process
- Deploy custom Exporter: Ensure custom Exporter has been deployed, and it exposes an endpoint that can be scraped by Prometheus.
- Create a Kubernetes Service: Create a Kubernetes Service for custom Exporter so that Prometheus can discover and scrape its metrics.
- Configure Servicemonitor: Write and apply Servicemonitor to monitor custom Exporter.
- Verify monitoring data: In openFuyao platform, select "Monitoring" in left navigation bar, click "Monitoring Targets", check whether monitoring target exists and whether its health status is "up".
Interface Description
Table 1 Main Interface Description
| Interface Name | Description |
|---|---|
| GET /rest/monitoring/v1/targets | Get monitoring targets. |
Development Steps
Deploy custom Exporter
1.1 Create Exporter YAML file (using Deployment as example). Write custom Exporter YAML file, select appropriate Kubernetes resource type according to Exporter characteristics.
Create a YAML file named "exporter-deployment.yaml" with content as follows:
yamlapiVersion: apps/v1 kind: Deployment metadata: labels: app: my-exporter name: my-exporter namespace: my-exporter-namespace spec: replicas: 3 selector: matchLabels: app: my-exporter template: metadata: labels: app: my-exporter spec: containers: - name: my-exporter image: my-exporter-image:latest ports: - containerPort: 91001.2 Apply Exporter YAML file (using Deployment as example). Apply Exporter to Kubernetes cluster to make it start running.
Use kubectl to apply Deployment resource to Kubernetes cluster, execute following command:
kubectl apply -f exporter-deployment.yamlCreate a Kubernetes Service.
2.1 Write Exporter Service so that Prometheus can discover and scrape its metrics.
Create a YAML file named exporter-service.yaml with content as follows:
yamlapiVersion: v1 kind: Service metadata: labels: app: my-exporter name: my-exporter namespace: my-exporter-namespace spec: ports: - port: 9100 targetPort: 9100 selector: app: my-exporter Note:
Note:- app: my-exporter label matches Exporter Deployment label.
- Port number 9100 is consistent with port used by Exporter.
2.2 Apply Exporter Service to cluster so that Prometheus can discover Exporter and scrape its metrics.
Use kubectl to apply Service resource to Kubernetes cluster, execute following command:
kubectl apply -f exporter-service.yamlConfigure Servicemonitor to monitor custom Exporter.
3.1 Define Servicemonitor resource, write Servicemonitor YAML file to define monitoring target.
Create a YAML file named service-monitor.yaml with content as follows:
yamlapiVersion: monitoring.coreos.com/v1 kind: ServiceMonitor metadata: name: my-exporter-servicemonitor namespace: my-exporter-servicemonitor-namespace spec: endpoints: - interval: 30s port: 9100 path: /metrics selector: matchLabels: app: my-exporter namespaceSelector: matchNames: - my-exporter-namespace Note: - Ensure app: my-exporter label matches Exporter Service label.
- Ensure port number 9100 is consistent with port used by Exporter.
3.2 Apply Servicemonitor resource so that Prometheus can discover Exporter and scrape monitoring data.
Use kubectl to apply Servicemonitor resource to Kubernetes cluster, execute following command:
kubectl apply -f service-monitor.yaml
Testing and Verification
In left navigation bar "Observability Center" of openFuyao platform interface, select "Monitoring > Monitoring Targets", enter "Monitoring Targets" interface. Find corresponding monitoring name in page, and status displays as "up", indicating that this monitoring target configuration is successful.
Licensed under the MulanPSL2
 YueGongWangAnBei No.44030002007300