AI Inference Eagle Eye
Feature Introduction
Eagle Eye is an observability system designed for AI inference scenarios, implementing full-chain metric collection, near real-time transmission, and intelligent diagnosis from AI gateway, inference engine, Mooncake to infrastructure (Ray, K8s, hardware). This system integrates Prometheus periodic metric collection with distributed message queue system low-latency push mechanisms, supporting both trend analysis for scaling decisions and meeting the needs of modules with high timeliness requirements (such as intelligent routing) for second-level data updates. Through an independent hardware health diagnosis module, it achieves continuous monitoring and anomaly identification of underlying metrics such as NPU/GPU, temperature, power consumption, and error codes, constructing a closed-loop monitoring capability of "collection — transmission — diagnosis — assessment", providing solid data support for the stability, performance optimization, and resource scheduling of AI inference systems.
Application Scenarios
- System Resource Health Monitoring: Real-time monitoring of infrastructure (Ray, K8s, hardware), ensuring health and stability of system resources, timely discovering and resolving resource bottlenecks, ensuring efficient system operation.
- Inference Process Performance Optimization: Real-time monitoring of performance metrics (such as latency, throughput) and resource usage at various stages of the inference process (such as prefill, decode, etc.), identifying and analyzing performance bottlenecks, optimizing model execution efficiency, improving response speed and computational efficiency of inference tasks.
- Hardware Fault Diagnosis and Repair: Viewing anomaly analysis reports provided by the hardware diagnosis module, which include fault pattern identification and handling recommendations, helping quickly locate and resolve hardware faults. The system can monitor NPU/GPU, temperature, power consumption, and other hardware states in real-time, generate detailed fault analysis reports, provide specific fault causes and repair solutions, ensuring hardware stability and reliability.
- Auto Scaling Decision: Obtaining SLA-related metrics (such as throughput rate, latency, etc.), using these data as the basis for auto scaling decisions, ensuring inference services dynamically expand or shrink according to load and performance requirements, achieving elastic scaling goals.
- Intelligent Routing Decision: Achieving near real-time data updates through distributed message queue system, enabling intelligent routing to make decisions quickly based on the latest data, thereby optimizing response speed during AI inference processes.
- Weight Distribution Acceleration Decision: Achieving near real-time data transmission through distributed message queue system, obtaining real-time network dynamic performance metrics (such as actual transmission rate of node RDMA network cards, remaining available bandwidth, etc.), and combining static metrics (such as theoretical transmission speed of node RDMA network cards, network card PCIe bandwidth, etc.) attached to nodes by NPU Feature Discovery in label form. Based on these metrics, the module dynamically evaluates node performance, ultimately selecting the node with optimal performance for task assignment, thereby ensuring optimal resource utilization and maximizing system stability and processing efficiency.
Capability Scope
- Multi-layer Metric Coverage: Covers AI gateway (such as performance, resource consumption, security and compliance auditing, governance policy execution records), inference engine (API Server, model input/output, inference process, inference engine status), Mooncake (Mooncake master, transfer engine, Mooncake client), and infrastructure (Ray, K8S, hardware), achieving full-chain observability.
- Near Real-time Metric Transmission: For modules with high timeliness requirements, achieving second-level metric push through distributed message queue system, ensuring metrics can be timely perceived and influence decisions.
- Scaling Decision Support: Synchronizing collected system and runtime metrics to Prometheus for periodic calculation and trend assessment.
- Hardware Health Check and Diagnosis: Building an independent hardware health diagnosis module, periodically collecting underlying metrics such as NPU/GPU temperature, power consumption, error codes, etc., and reporting them in real-time through distributed message queue system. The diagnosis module subscribes to and analyzes collected data, combining device model, driver and firmware information, based on threshold rules and abnormal metric analysis, identifying typical fault patterns and outputting diagnosis conclusions and handling recommendations, achieving a closed loop from data collection to health assessment.
Implementation Principle
Logical View
Figure 1 Layer 0 Logical View
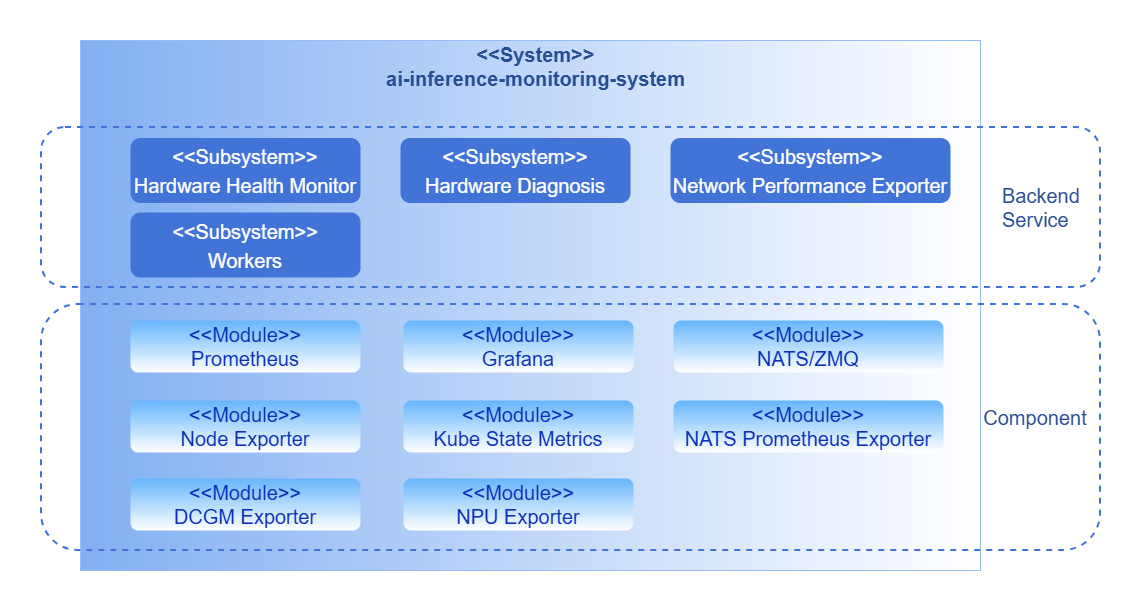
The monitoring system is divided into backend layer and component layer according to business hierarchy.
Backend Layer
- Hardware Health Monitor: The hardware health monitoring module operates as an independent collection component, actively executing metric collection and reporting as periodic tasks. During operation, the module calls underlying interfaces (DCMI, NVML) or parses system logs (dmesg) at fixed collection intervals to obtain device running status and health information. Collection results are published in real-time through distributed message queue system to the diagnosis module, achieving decoupling of collection and diagnosis.
- Hardware Diagnosis: The diagnosis module subscribes to metric data published by the collection module through distributed message queue system, combining device model, driver and firmware information to perform real-time analysis of hardware health status. The module supports threshold judgment and anomaly identification, identifying typical fault patterns and outputting diagnosis conclusions and handling recommendations, achieving a closed loop from data collection to health assessment.
Component Layer
The component layer provides underlying metric collection, transmission, and display capabilities, covering the following key modules: metric collection (Exporter), high-performance distributed message queue system, metric storage (Prometheus), and display (Grafana).
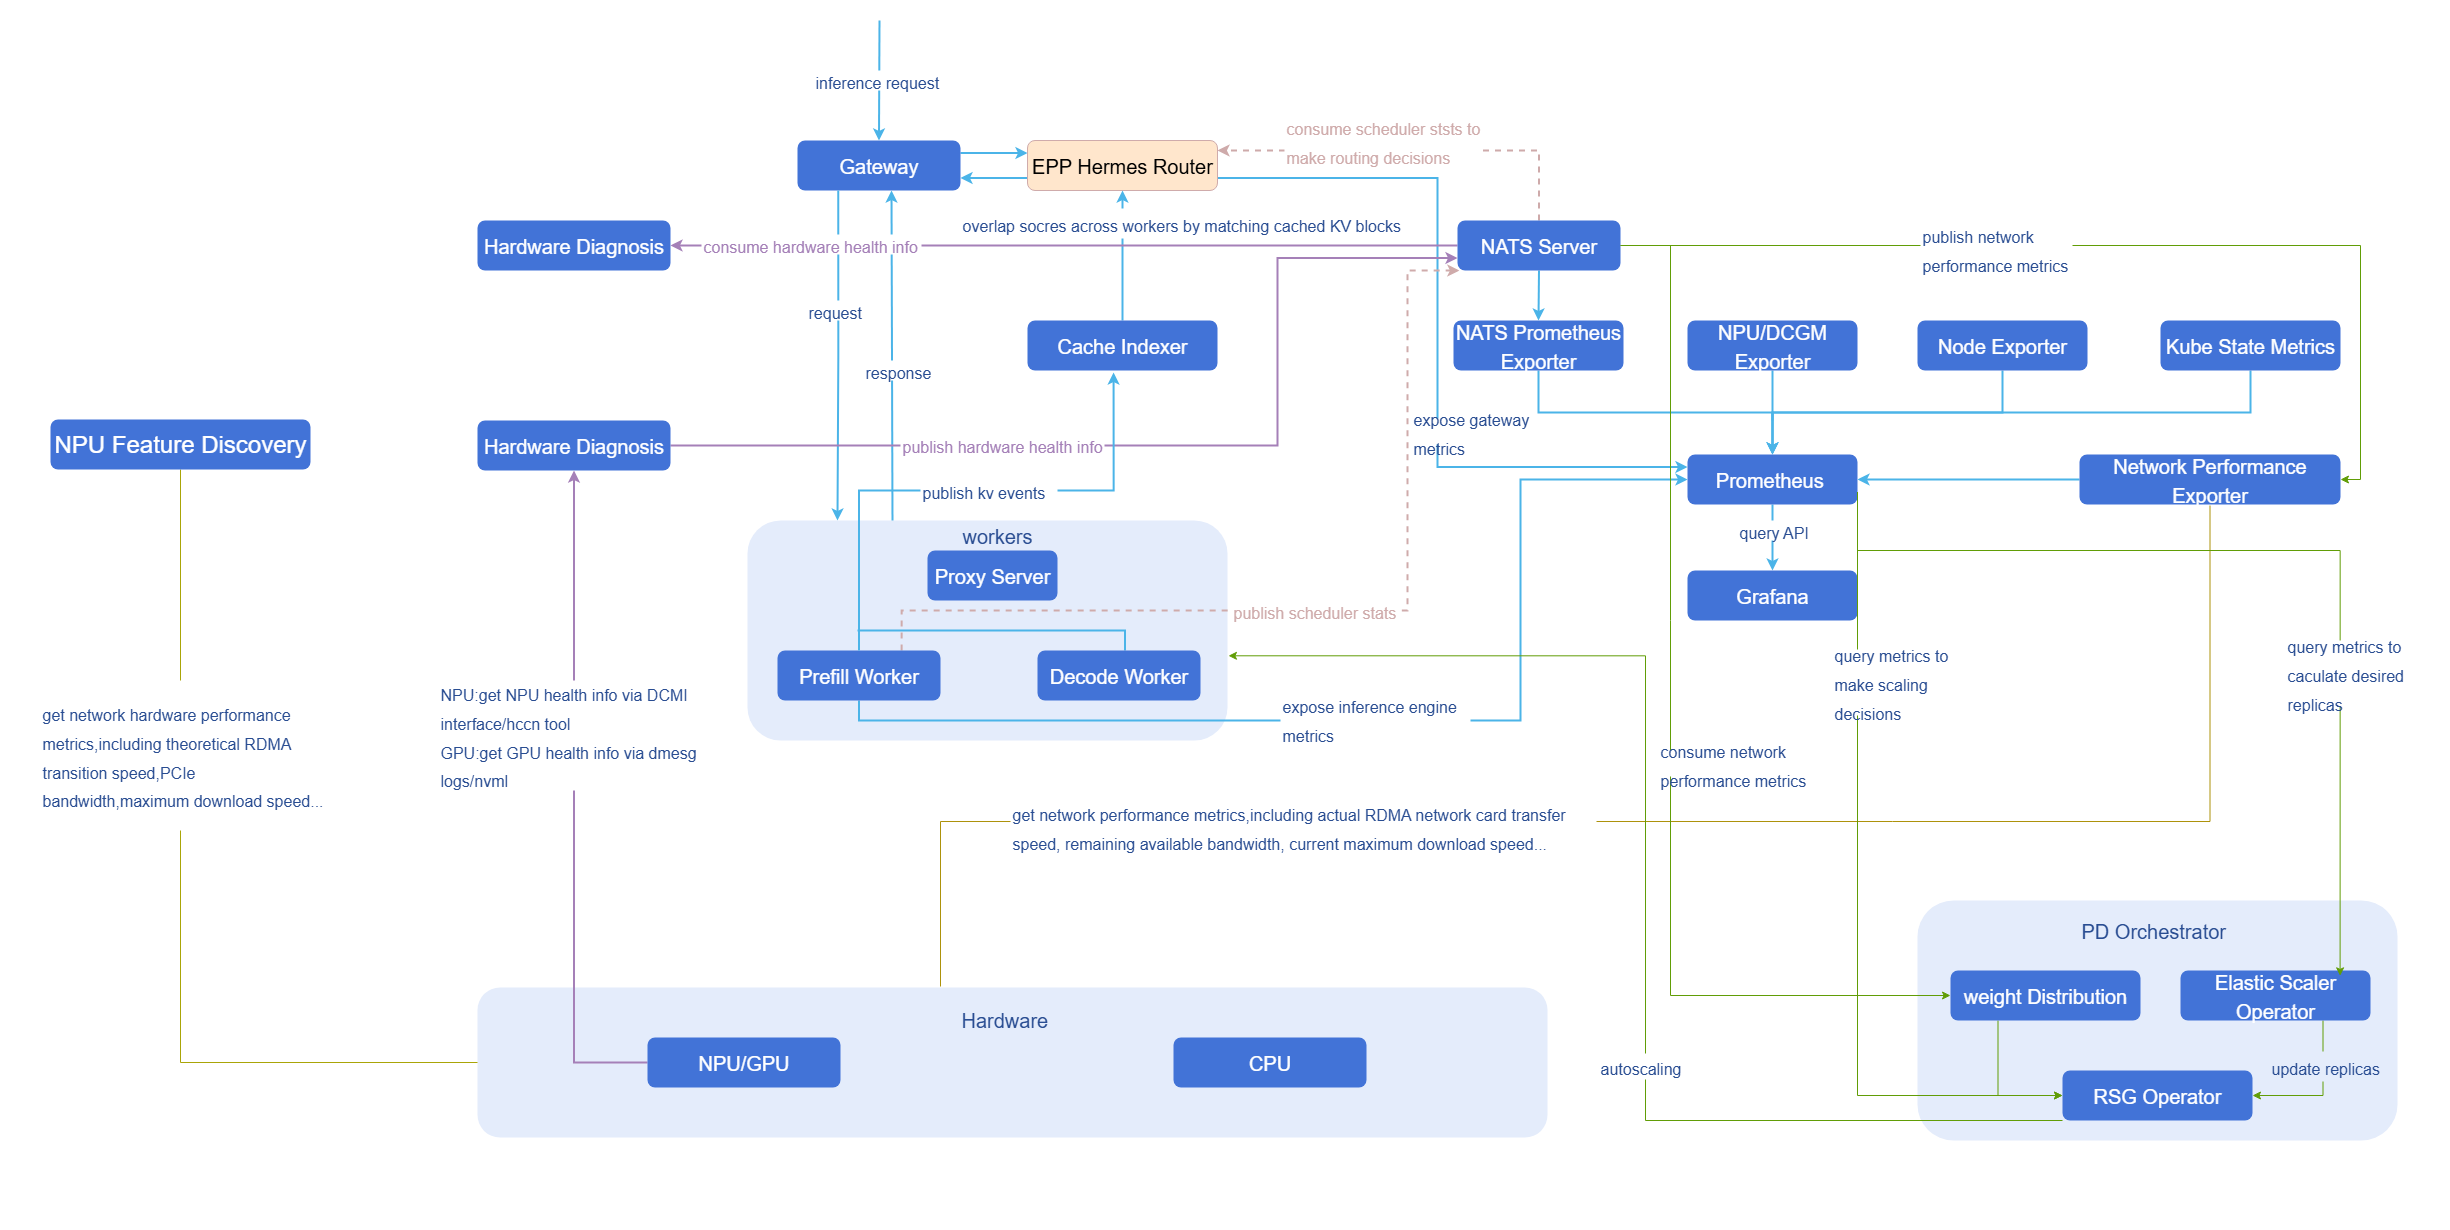
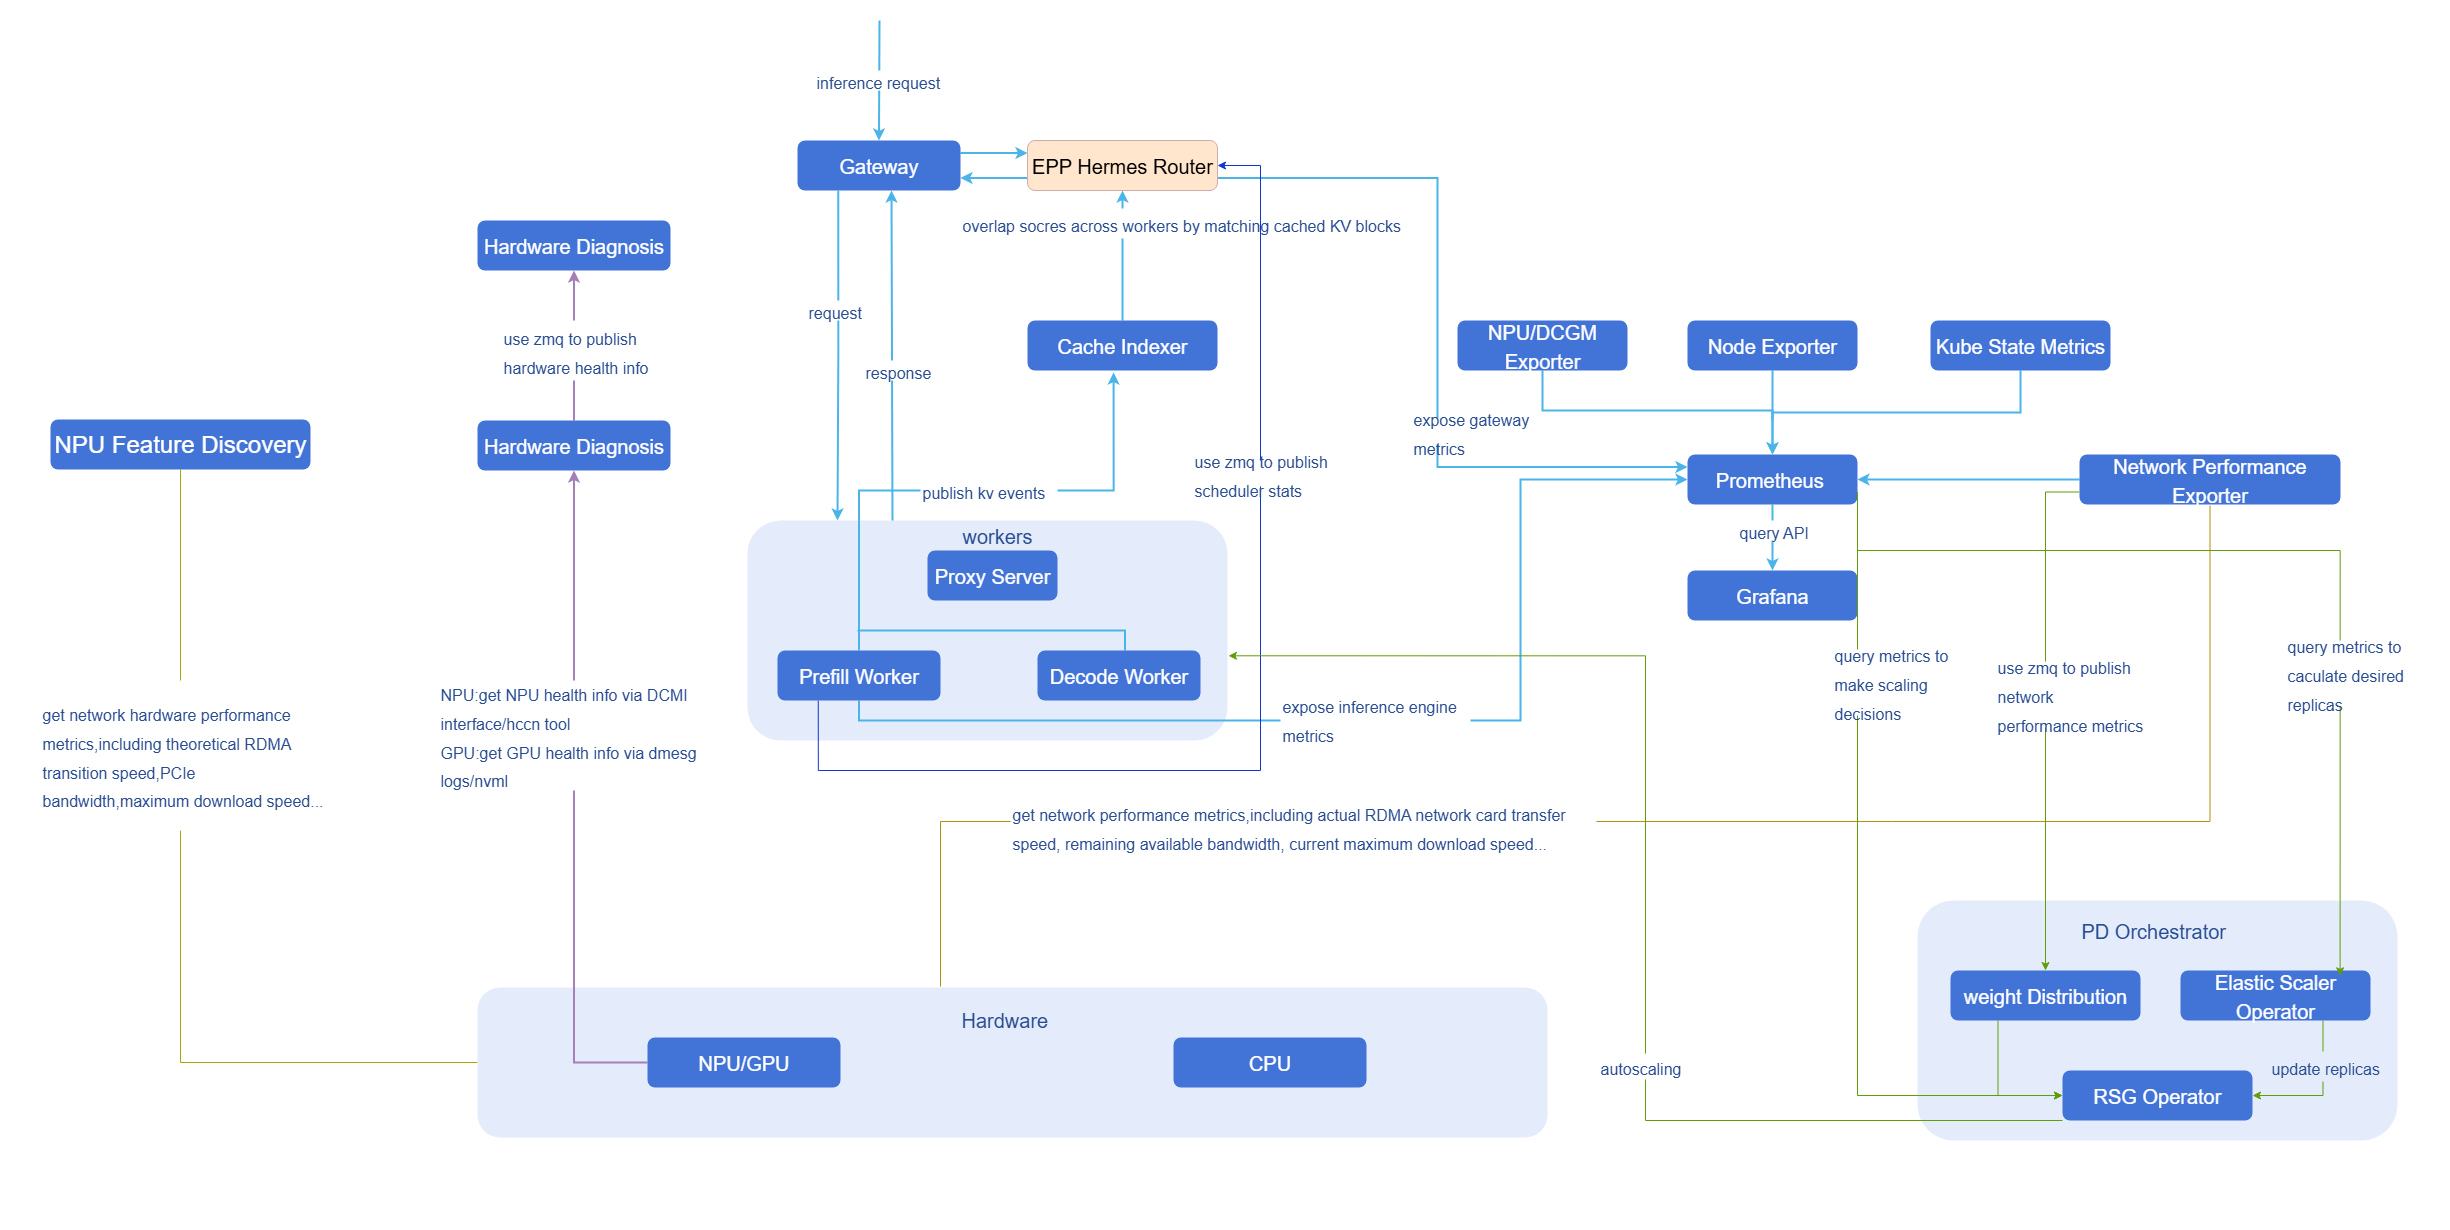
Data Flow Diagram
NATS
Figure 2 Data Flow Diagram - NATS
ZMQ
Figure 3 Data Flow Diagram - ZMQ
Full Data List
Table 1 Full Data List
| Observability Dimension | Observability Category | Observability Item | Observability Sub-item | Specific Metric | Static/Dynamic | Metric Source | Timeliness Requirement | Metric Transmission | Currently Supported | Remarks |
| AI Gateway | Performance | - | - | QPS | Dynamic | EPP | Low | Prometheus | - | - |
| Request success rate | - | |||||||||
| Overall latency of non-streaming responses | - | |||||||||
| First packet latency of streaming responses (TTFT) | - | |||||||||
| Resource consumption | - | - | Token consumption count/s | Dynamic | EPP | Low | Prometheus | Large model services billed by token | ||
| Token usage statistics by model dimension | EPP | |||||||||
| Token usage statistics by user dimension | - | |||||||||
| Security and compliance auditing | - | - | Content security interception logs | Dynamic | - | Low | Prometheus | - | ||
| Risk type statistics | - | - | ||||||||
| Risk user statistics | - | - | ||||||||
| Governance policy execution records | - | - | Rate limiting statistics | - | Low | Prometheus | - | |||
| Cache hit status | EPP | - | ||||||||
| Fallback success rate | - | - | ||||||||
| Inference Engine | API Server | - | - | Path | Dynamic | - | Low | Prometheus | - | - |
| Status code | - | |||||||||
| Client | - | |||||||||
| Duration | - | |||||||||
| Model input/output | - | - | Prompt | Static | - | Low | Prometheus | ✅ | Exposed as OpenTelemetry Trace attributes, needs to be enabled when deploying vLLM. vllm serve your-model --otlp-traces-endpoint="http://your-collector:4317" --collect-detailed-traces=all | |
| Response mode | - | |||||||||
| Model name | vLLM | |||||||||
| Maximum token count | vLLM | |||||||||
| Temperature | vLLM | |||||||||
| top-k | - | |||||||||
| top-p | vLLM | |||||||||
| N | vLLM | |||||||||
| Inference process | - | - | E2E time | Dynamic | vLLM | Low | Prometheus | - | ||
| TTFT | - | |||||||||
| Prefill time | - | |||||||||
| Decode time | - | |||||||||
| Request waiting time in scheduler | - | |||||||||
| Token interval time | - | |||||||||
| Inference engine status | - | - | Running request count | Dynamic | vLLM | Low | Prometheus | - | ||
| Waiting request count | - | |||||||||
| Preempted request count | - | |||||||||
| KV cache utilization | - | |||||||||
| Total prompt token count | - | |||||||||
| Total generated token count | - | |||||||||
| Successfully processed request count | - | |||||||||
| Mooncake | Mooncake master | - | - | - | Dynamic | Mooncake | Low | Prometheus | - | Mooncake master exposes metrics directly to Prometheus through /metrics, while transfer engine and Mooncake client metrics are recorded in logs. |
| transfer engine | - | - | - | Dynamic | Low | Prometheus | ||||
| Mooncake client | - | - | - | Dynamic | Low | Prometheus | ||||
| Infrastructure | ray | - | - | - | Dynamic | ray | Low | Prometheus | - | - |
| kubernetes | Cluster health | - | - | Dynamic | kube-state-metrics/node-exporter | Low | Prometheus | ✅ | - | |
| Resource usage | - | - | - | |||||||
| Workload status | - | - | - | |||||||
| Scheduling and elasticity | Scheduling | Scheduling queue | kube-scheduler | Prometheus | ✅ | - | ||||
| Scheduling latency | - | |||||||||
| Scheduling success/failure rate | - | |||||||||
| Retry count | - | |||||||||
| Elasticity | Desired replica count | kube-state-metrics | Prometheus | ✅ | - | |||||
| Current replica count | - | |||||||||
| Ready replica count | - | |||||||||
| Scaling latency | - | - | - | |||||||
| Image pull time | kubelet | ✅ | - | |||||||
| Weight download time | - | - | - | |||||||
| Scaling trigger count | - | - | - | |||||||
| Hardware | Computing resources | - | machine_npu_nums | Dynamic | npu-exporter | Low | Prometheus | ✅ | - | |
| npu_chip_info_utilization | - | |||||||||
| npu_chip_info_overall_utilization | - | |||||||||
| npu_chip_info_vector_utilization | - | |||||||||
| npu_chip_info_temperature | - | |||||||||
| npu_chip_info_power | - | |||||||||
| npu_chip_info_voltage | - | |||||||||
| npu_chip_info_aicore_current_freq | - | |||||||||
| npu_chip_info_process_info_num | - | |||||||||
| npu_chip_info_process_info | - | |||||||||
| container_npu_utilization | - | |||||||||
| container_npu_total_memory | - | |||||||||
| container_npu_used_memory | - | |||||||||
| Memory and VRAM | hbm (910A1/910A2/910A3/910A5) | npu_chip_info_hbm_used_memory | - | |||||||
| npu_chip_info_hbm_total_memory | - | |||||||||
| npu_chip_info_hbm_utilization | - | |||||||||
| npu_chip_info_hbm_temperature | - | |||||||||
| npu_chip_info_hbm_bandwidth_utilization | - | |||||||||
| npu_chip_info_hbm_ecc_enable_flag | - | |||||||||
| npu_chip_info_hbm_ecc_single_bit_error_cnt | - | |||||||||
| npu_chip_info_hbm_ecc_double_bit_error_cnt | - | |||||||||
| npu_chip_info_hbm_ecc_total_single_bit_error_cnt | - | |||||||||
| npu_chip_info_hbm_ecc_total_double_bit_error_cnt | - | |||||||||
| npu_chip_info_hbm_ecc_single_bit_isolated_pages_cnt | - | |||||||||
| npu_chip_info_hbm_ecc_double_bit_isolated_pages_cnt | - | |||||||||
| ddr (except 910A2/910A3/910A5) | npu_chip_info_total_memory | - | ||||||||
| npu_chip_info_used_memory | - | |||||||||
| Interconnect and IO | network (except 310/310B/310P) | npu_chip_info_bandwidth_tx | - | |||||||
| npu_chip_info_bandwidth_rx | - | |||||||||
| npu_chip_link_speed | - | |||||||||
| npu_chip_link_up_num | - | |||||||||
| pcie (910A2) | npu_chip_info_pcie_rx_p_bw | - | ||||||||
| npu_chip_info_pcie_rx_np_bw | - | |||||||||
| npu_chip_info_pcie_rx_cpl_bw | - | |||||||||
| npu_chip_info_pcie_tx_p_bw | - | |||||||||
| npu_chip_info_pcie_tx_np_bw | - | |||||||||
| npu_chip_info_pcie_tx_cpl_bw | - | |||||||||
| hccs (910A2/910A3) | npu_chip_info_hccs_statistic_info_tx_cnt_index | - | ||||||||
| npu_chip_info_hccs_statistic_info_rx_cnt_index | - | |||||||||
| npu_chip_info_hccs_statistic_info_crc_err_cnt_index | - | |||||||||
| npu_chip_info_hccs_bandwidth_info_tx_index | - | |||||||||
| npu_chip_info_hccs_bandwidth_info_rx_index | - | |||||||||
| npu_chip_info_hccs_bandwidth_info_profiling_time | - | |||||||||
| npu_chip_info_hccs_bandwidth_info_total_tx | - | |||||||||
| npu_chip_info_hccs_bandwidth_info_total_rx | - | |||||||||
| roce (except 310/310B/310P) | npu_chip_mac_rx_pause_num | - | ||||||||
| npu_chip_mac_tx_pause_num | - | |||||||||
| npu_chip_mac_rx_pfc_pkt_num | - | |||||||||
| npu_chip_mac_tx_pfc_pkt_num | - | |||||||||
| npu_chip_mac_rx_bad_pkt_num | - | |||||||||
| npu_chip_mac_tx_bad_pkt_num | - | |||||||||
| npu_chip_mac_tx_bad_oct_num | - | |||||||||
| npu_chip_mac_rx_bad_oct_num | - | |||||||||
| npu_chip_info_rx_fcs_num | - | |||||||||
| npu_chip_info_rx_ecn_num | - | |||||||||
| npu_chip_roce_rx_all_pkt_num | - | |||||||||
| npu_chip_roce_tx_all_pkt_num | - | |||||||||
| npu_chip_roce_rx_err_pkt_num | - | |||||||||
| npu_chip_roce_tx_err_pkt_num | - | |||||||||
| npu_chip_roce_rx_cnp_pkt_num | - | |||||||||
| npu_chip_roce_tx_cnp_pkt_num | - | |||||||||
| npu_chip_roce_new_pkt_rty_num | - | |||||||||
| npu_chip_roce_out_of_order_num | - | |||||||||
| npu_chip_roce_qp_status_err_num | - | |||||||||
| npu_chip_roce_unexpected_ack_num | - | |||||||||
| npu_chip_roce_verification_err_num | - | |||||||||
| Network hardware performance | - | Node RDMA network card theoretical bandwidth limit | Static | npu-feature-discovery | Low | / | ✅ | - | ||
| Node RDMA network card PCIe bandwidth | ||||||||||
| NPU card side RoCE network card total bandwidth | ||||||||||
| - | Node RDMA network card link status | Dynamic | network-performace-exporter | High | Prometheus NATS/ZMQ | ✅ | - | |||
| Node RDMA network card physical link status | ||||||||||
| Node RDMA network card cumulative sent traffic | ||||||||||
| Node RDMA network card cumulative received traffic | ||||||||||
| Node RDMA network card actual sending rate | ||||||||||
| Node RDMA network card actual receiving rate | ||||||||||
| Node RDMA network card sending direction remaining bandwidth | ||||||||||
| Node RDMA network card receiving direction remaining bandwidth | ||||||||||
| NPU card side RoCE network card physical link status | ||||||||||
| NPU card side RoCE network card physical link UP count | ||||||||||
| NPU card side RoCE network card actual sending rate | ||||||||||
| NPU card side RoCE network card actual receiving rate | ||||||||||
| NPU card side RoCE network card sending direction remaining bandwidth | ||||||||||
| NPU card side RoCE network card receiving direction remaining bandwidth | ||||||||||
| NPU card side RoCE network card packet loss rate | ||||||||||
| NPU card side RoCE network card retransmission rate | ||||||||||
| Hardware health | Black box error code | - | Dynamic | eagle-eye-hardware-monitor | High | NATS/ZMQ | ✅ | - | ||
| Health management fault code | - | - | ||||||||
| hbm (910A1/910A2/910A3/910A5) | npu_chip_info_hbm_temperature | - | ||||||||
| npu_chip_info_hbm_total_memory | - | |||||||||
| npu_chip_info_hbm_used_memory | - | |||||||||
| npu_chip_info_hbm_memory_utilization | - | |||||||||
| ddr (except 910A2/910A3/910A5) | npu_chip_info_memory_utilization | - | ||||||||
| network (except 310/310B/310P) | npu_chip_info_link_status | - | ||||||||
| npu_chip_info_bandwidth_rx | - | |||||||||
| npu_chip_info_bandwidth_tx | - | |||||||||
| Hardware status | npu_chip_info_power | NPU overload frequency reduction | ||||||||
| npu_chip_info_aicore_freq | ||||||||||
| npu_chip_info_aicore_current_freq | ||||||||||
| npu_chip_info_temperature | ||||||||||
| npu_chip_info_network_status | - | |||||||||
| npu_chip_info_health_status | - |
Notice: network performance exporter, hardware monitor, hardware diagnosis, and npu exporter must be deployed with privileged containers enabled, otherwise DCMI cannot be loaded, causing data to not be collected correctly.
Relationship with Related Features
Depends on inference engine (such as vLLM).
Installation
Prerequisites
Hardware Requirements
Eagle Eye itself has no special hardware environment requirements.
Software Requirements
Kubernetes v1.33.0 or above.
Start Installation
openFuyao Platform
Log in to openFuyao management plane.
Select "Application Marketplace > Application List" in the left navigation bar to jump to the "Application List" interface.
Check "Artificial Intelligence / Machine Learning" in "Scenarios" on the left side, find the "eagle-eye" card. Or enter "eagle-eye" in the search box.
Click "Deploy" to enter the "Deploy" interface.
Enter application name, select installation version and namespace. Namespace can use existing namespace or create a new namespace, for creating namespace please refer to Namespace.
Configure eagle-eye in the "values.yaml" in parameter configuration.
Notice: networkPerformanceExporter.collectIntervalis used to configure network-performance-exporter collection interval (unit: seconds), default value is 15s. If this value is configured too short, it may cause the next collection task to trigger before the previous one completes, resulting in incomplete metric data. It is recommended not to be lower than the default value of 15s.Click "Deploy" to complete installation.
Standalone Deployment
Besides openFuyao platform installation and deployment, this feature also provides standalone deployment functionality, with the following two ways:
- Obtain project installation package from openFuyao official image repository.
Execute the following command to pull project installation package.
helm pull oci://cr.openfuyao.cn/charts/eagle-eye --version xxxWhere
xxxneeds to be replaced with specific project installation package version, such as0.0.0-latest. The pulled installation package is in compressed package format.Execute the following command to extract installation package.
cdtar -zxvf eagle-eyeInstall and deploy.
Execute the following command in the same level directory as eagle-eye.
helm install eagle-eye -n xxxxxx .
- Obtain from openFuyao GitCode repository.
Execute the following command to clone project from repository.
git clone https://gitcode.com/openFuyao/eagle-eye.gitInstall and deploy. Execute the following command in the same level directory as eagle-eye.
helm install eagle-eye -n xxxxxx .
High Real-time Metric Collection and Reporting for Intelligent Routing
NATS
To meet the high timeliness requirements of modules such as intelligent routing, the system uses NATS for second-level push of key performance metrics. This enables metrics such as waiting request count and NPU/GPU KVCache utilization to be perceived in real-time, thereby dynamically adjusting decisions.
Currently only supports vLLM deployment.
Prerequisites
- Kubernetes cluster has been deployed and can be accessed normally
kubectlcommand line tool has been installed and cluster access permissions configured- Ascend driver and related dependencies have been installed on nodes
- NATS has been deployed and running normally
Deployment Steps
Select NATS publish/subscribe model as the metric transmission method. CustomStatLogger is a custom statistics data recorder implemented in vLLM by inheriting the StatLoggerBase abstract class. As the publisher, CustomStatLogger generates structured runtime metric messages after each decode batch ends, and publishes them to the specified NATS topic; Router as the subscriber only needs to register listening on that topic to receive messages instantly upon publication and trigger subsequent processing logic.
To avoid first message loss, the subscriber (Router) must complete connection and subscription before the publisher (CustomStatLogger).
Router (Subscriber).
Routeras the subscriber mainly receives published runtime metric messages and triggers corresponding processing logic. Refer to the following code example to implementRouterand deploy it to the Kubernetes cluster.import logging import json from nats.aio.client import Client as NATS_Client logger = logging.getLogger() class RouterSubscriber: def __init__(self, server_address: str, topic: str): """ Initialize RouterSubscriber instance :param server_address: NATS server address :param topic: Topic to subscribe to """ self.server_address = server_address self.topic = topic self.client = NATS_Client() async def connect(self): """ Establish connection with NATS server """ try: # Establish NATS persistent connection await self.client.connect(self.server_address) logger.info("Connected to NATS server at %s", self.server_address) except Exception as e: logger.error("Failed to connect to NATS server: %s", e) raise e async def subscribe(self, topic: str, message_handler): """ Subscribe to specified topic and hand received messages to business logic processing :param message_handler: Business logic processing function for handling received messages """ try: async def on_message(msg): """ Message callback function, handles subscribed messages :param msg: NATS message """ logger.info("Received message on topic %s", topic) await message_handler(msg) # Ensure NATS connection if not self.client.is_connected: await self.connect() # Register subscription topic and bind message callback function await self.client.subscribe(topic, cb=on_message) logger.info("Successfully subscribed to NATS topic %s", topic) except Exception as e: logger.error("Failed to subscribe to NATS topic %s: %s", topic, e) raise e async def message_handler(self, msg) -> None: """ NATS raw callback, responsible for: 1. Decoding data from msg; 2. Calling parse_message for JSON deserialization; 3. Handing parsed structured data to subsequent business logic processing. """ try: data = msg.data.decode("utf-8") except Exception as exc: logger.error("Failed to decode NATS message: %s", exc) return data_dict = self.parse_message(data) if not data_dict: # Return directly on parse failure, avoid subsequent logic exceptions return # TODO: Handle specific business logic here, such as making routing decisions based on metrics ... def parse_message(self, data: str) -> Dict[str, Any]: """ Deserialize NATS message body from JSON string to dictionary. Log and return empty dictionary on parse failure. """ try: return json.loads(data) except Exception as exc: logger.error("Failed to parse message: %s, raw: %r", exc, data) return {}Customstatlogger (Publisher).
CustomStatLoggeris the publisher, responsible for generating and publishing real-time runtime metric data. After each decode batch ends,CustomStatLoggerpublishes structured metric messages to the specified NATS topic (this topic should match the subscriber's topic, current topiceagle_eye.routing_metrics), forRouterto subscribe.2.1 Package source code.
Execute the following command in the project root directory to package source code into a compressed file.
bashtar -czf source_code.tar.gz src/ requirements.txt2.2 Create ConfigMap.
Import the compressed package as a binary file into ConfigMap.
bash# Check if namespace exists, create it if not kubectl get namespace ai-inference || kubectl create namespace ai-inference # If ConfigMap with same name already exists, delete it first kubectl delete configmap vllm-source-code -n ai-inference --ignore-not-found # Create new ConfigMap kubectl create configmap vllm-source-code \ --from-file=source_code.tar.gz=source_code.tar.gz \ -n ai-inference2.3 Deploy service.
Apply deployment YAML file.
bashkubectl apply -f ./docs/routing-metrics/vllm_eagle_eye.yaml2.4 Check deployment status.
bash# View Pod running status kubectl get pods -n ai-inference -l app=vllm-eagle-eye # View Pod detailed information kubectl describe pod -n ai-inference -l app=vllm-eagle-eye # View Pod logs kubectl logs -n ai-inference -l app=vllm-eagle-eye -fVerification steps.
3.1 Method 1: Use temporary Pod for verification.
3.1.1 Get service Pod IP address.
bashkubectl get pod -n ai-inference -l app=vllm-eagle-eye -o wideRecord the
IPaddress in the output (for example:10.244.1.5).3.1.2 Start temporary test Pod.
bashkubectl run curl-test --image=curlimages/curl -n ai-inference -it --rm --restart=Never -- sh3.1.3 Send test request in temporary Pod.
Execute in the temporary Pod's shell (replace
<POD_IP>with actual IP address):bashcurl -X POST http://<POD_IP>:8000/generate \ -H "Content-Type: application/json" \ -d '{"prompt": "Hello AI"}'3.2 Method 2: Use port-forward for verification.
bash# Port forwarding kubectl port-forward -n ai-inference deployment/vllm-eagle-eye 8000:8000 # Send request in another terminal curl -X POST http://localhost:8000/generate \ -H "Content-Type: application/json" \ -d '{"prompt": "Hello AI"}'Clean up resources.
bash# Delete Deployment kubectl delete -f ./docs/routing-metrics/vllm_eagle_eye.yaml # Delete ConfigMap kubectl delete configmap vllm-source-code -n ai-inference # Delete temporary Pod kubectl delete pod -n ai-inference curl-test
Common Issues
Pod startup failure.
bash# View Pod events kubectl describe pod -n ai-inference -l app=vllm-eagle-eye # View init container logs kubectl logs -n ai-inference <pod-name> -c code-extractorDependency installation failure.
If the cluster cannot access the internet, dependencies need to be pre-packaged into the compressed package.
bash# Download dependencies locally pip download -r requirements.txt -d packages/ # Include dependencies when packaging tar -czf source_code.tar.gz src/ requirements.txt packages/
Licensed under the MulanPSL2
 YueGongWangAnBei No.44030002007300