Logs
Feature Overview
The logging feature can be implemented using an extension, which can be installed through the openFuyao application market. You can view logs of pods and containers, and configure log collection sources, collection tasks, and alerting rules. The openFuyao logging system can effectively improve the error identification efficiency and enhance the monitoring capability of the entire platform.
Applicable Scenarios
The openFuyao logging system is used for log management of the container platform infrastructure. O&M personnel can query, analyze, and quickly locate issues through the logging system. The application scenarios are as follows:
- Querying faulty applications and tracing causes: When an error occurs in an application or service on the container platform, O&M personnel can query the time and container name to locate the specific error log information to quickly locate the root cause and rectify the fault in a timely manner.
- Custom querying and filtering logs of applications: If the application you created is not a native Kubernetes application, it is difficult to obtain the logs using command-line instructions. This can be addressed by customizing the log collection source path. The logging system will automatically collect logs from the custom path.
- Log analysis: The system identifies abnormal modes or error messages based on log content and triggers alerts, helping O&M personnel quickly rectify problems or take optimization measures.
Supported Capabilities
Viewing logs: You can view logs based on basic filtering criteria, such as the namespace, container name, and log collection path.
Log alerting: When logs in the cluster meet the conditions defined in log alerting rules, the logging system sends corresponding alert information to the alerting component.
High availability (HA): The logging system can be deployed in HA mode, running multiple instances to prevent single points of failure.
Custom log collection sources: You can add or remove log collection sources to allow the platform to flexibly collect logs of various applications.
Custom query range and keyword filtering: You can quickly query the expected filtering results through various methods, including searching keywords, customizing time range restrictions, and filtering logs based on log levels.
Highlights
Efficient Log Collection and Management
You can collect and query logs of various services and containers in real time based on custom filter criteria. The custom filter criteria include, but are not limited to, the namespace, service name, container name, keyword, time range, log collection path, file name, and log type and level. You can combine multiple criteria to achieve precise queries.
Precise Fault Locating
After selecting a log source (for example, a specific container or log path), you can accurately locate all logs with a fine-grained time span. The system also supports contextual log queries by custom time range. After locating a key log, you can query contextual logs as required.
Diversified Log Collection Capabilities
You can set log collection paths to collect logs generated by user-defined applications. You can add a log collection source without changing the default configuration. In addition, you can customize the log collection task, allowing the log collection component to collect logs in the specified path. You can view the logs of the application on the query page using the "path+file name" format.
Sensitive Log Alerting
The system allows users to create log alerting rules when installing log components, and provides log alerting rule templates and preset log alerting rules. When collected logs match alert rules, the system pushes an alert to the alerting component, delivering a one-stop fault detection flow that covers log monitoring, alerting, and root-cause localization.
Log Export and Download
You can export any log content you want to retain from the log component. In the current version, you can filter and export logs. You can filter the logs of a single container by time on the log details page.
Implementation Principles
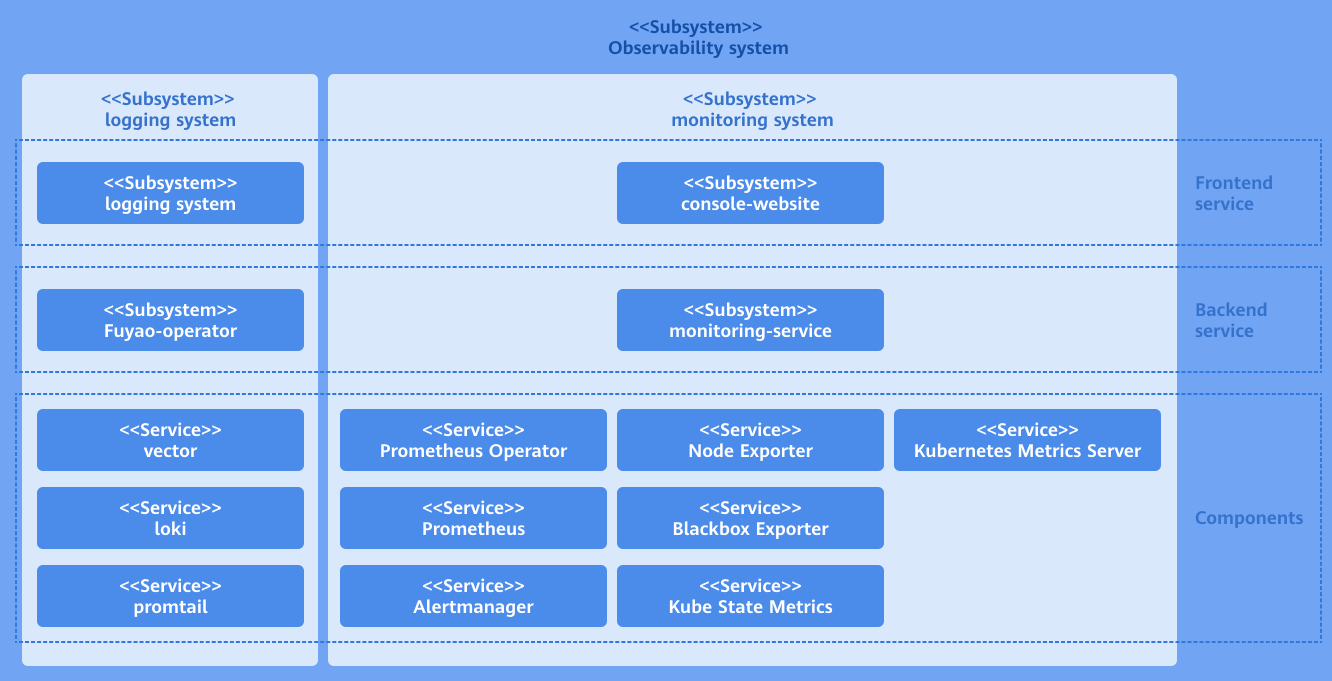
As an ecosystem extension of openFuyao, the log component consists of three parts: log backend layer, log UI layer, and open-source software layer.
Log backend layer
The logging-operator backend is deployed in the cluster as a microservice. It provides core capabilities for the log extension, such as APIs for log query and filtering, APIs for querying log collection sources, APIs for querying log alerting rules, APIs for adding, deleting, modifying, and querying log collection tasks, and APIs for querying contextual log details.
The backend processing logic of the logging-operator is as follows: After receiving a call request from the frontend, it generates a LogQL query statement used by the Loki component based on the specific request content. It assembles this LogQL into a query request for calling the Loki HTTP API to obtain the query and filtering results in the Loki component. Then, it assembles the response based on the specific return logic and returns it to the original calling API. The collection source configuration function calls the client-go API of Kubernetes to add, delete, modify, and query Kubernetes cluster resources.
Log UI layer
The frontend UI part of the log component is independently deployed on the openFuyao platform as a scalable, pluggable component. After the UI part is installed and deployed on the openFuyao platform, the log UI is automatically integrated into the left navigation pane of the console-website. You can use the log component directly from the left navigation pane of the openFuyao management plane. If the openFuyao platform is not installed in the cluster, the log UI can be deployed together with the log backend and the log open-source software as an independent log application. In this case, the log UI layer is an independent interface.
Log Open-source Software Layer
The open-source log software provides underlying support capabilities for the logging system. It consists of the log collection component (promtail) and the log storage component (Loki). The log collection component is deployed on each node as a DaemonSet and forwards logs from collection sources to the log storage component based on collection rules. Loki receives the HTTP requests, queries logs in the log database, and returns the results.
Figure 1 Implementation principles
Related Features
The alerting system triggers notifications based on configured alert sources (such as Prometheus and Loki) and associated alert rules.
Installation
openFuyao Platform
Log in to the openFuyao platform. The Summary page is displayed by default. In the left navigation pane, choose Application Market > Applications. The Applications page is displayed.
Select Extension under Type on the left.
Click the logging-package application card. The application details page is displayed.
On the details page, click Deploy in the upper-right corner.
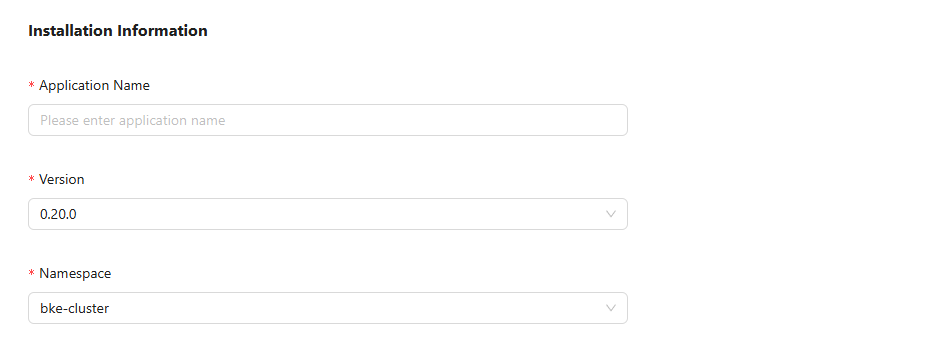
In the Installation Information area on the deployment page, set the application name, version information, and namespace. Set the namespace to default.
Figure 2 Installation information
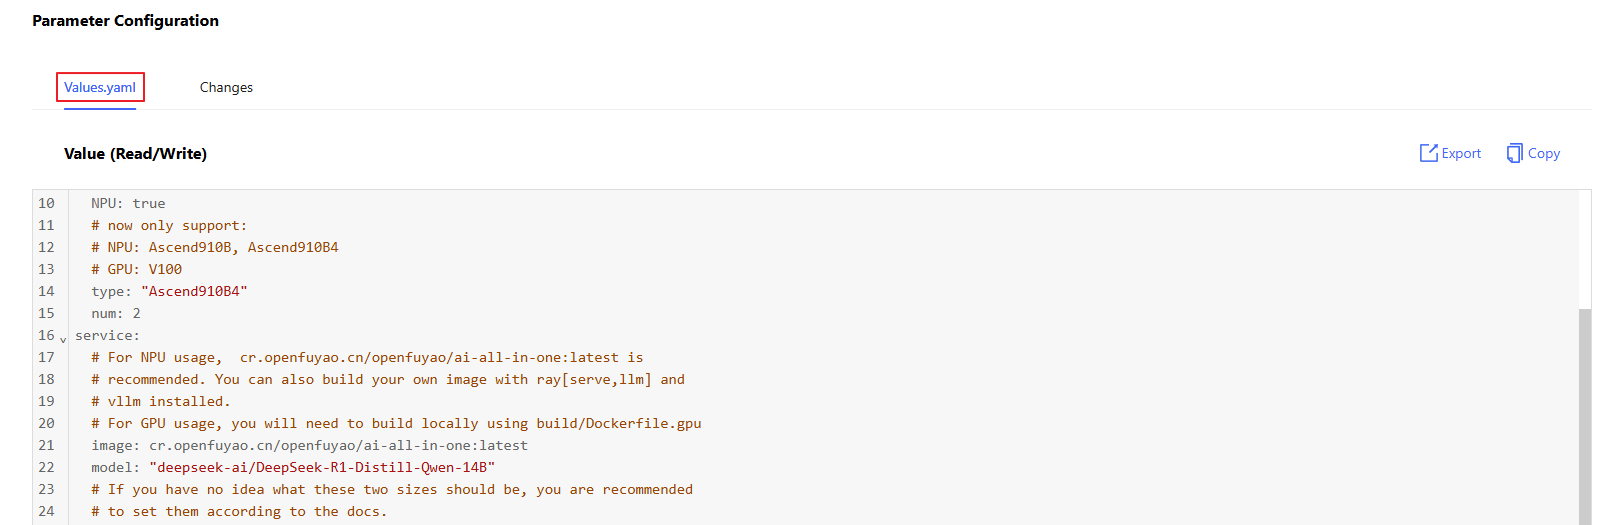
In the Parameter Configuration area, you can view the configuration of each configurable field on the preview page of Values.yaml.
Figure 3 YAML configuration
Click OK.
Standalone Deployment
Installation
1.1 Obtain the logging-package Helm package.
wget https://harbor.openfuyao.com/chartrepo/openfuyao-catalog/charts/logging-package-0.13.0.tgz1.2 In the parameter configuration, enter the values information to be deployed in values.yaml.
1.3 Deploy using Helm.
tar -zxf logging-package-0.13.0.tgz
helm install logging -n default ./logging-package
1.4 Verify the installation and access.
Confirm that the logging package has been successfully deployed.
kubectl get pods -n default
kubectl get pods -n openfuyao-system
kubectl get pods -n loki
Confirm that the service has been exposed.
kubectl get svc -n default | grep loggingAccess the logging-website interface.
http://<Node_IP>:<logging.service.nodePort>
Configure the time limit from log creation to present and the log storage retention policy.
reject_old_samples_max_age: This field specifies the maximum time span supported by the log collector, which is 168 hours (default configuration), that is, the maximum duration from the log creation time to the current time. With the default configuration, logs that were created more than 7 days ago will not be collected by the collection component.
retention_deletes_enabled: This field specifies whether to enable automatic deletion of old log data. The default configuration is false. With the default configuration, collected logs are permanently retained, and no automatic old log deletion policy is applied.
retention_period: This field takes effect only when retention_deletes_enabled is enabled. This configuration defines the time period after which collected logs are purged from storage.
yamlloki-stack: loki: config: limits_config: reject_old_samples_max_age: 168h table_manager: retention_deletes_enabled: false retention_period: 0sConfigure the log collection source.
This configuration defines the detailed settings of the log collection source and specifies the root directory path for the collector. When configuring, you must set both defaultVolumes and defaultVolumeMounts, and ensure that the path in defaultVolumes and the mountPath in defaultVolumeMounts are consistent. The specified collection source path must be readable. If the path is not readable, the configuration will not take effect.
 Note:
Note:
Once the collection source configuration takes effect, it cannot be changed.The following content needs to be configured:
yamlloki-stack: namespace: loki promtail: defaultVolumes: - name: containers hostPath: path: /var/lib/docker/containers - name: pods hostPath: path: /var/log/pods - name: random hostPath: path: /var/log/random defaultVolumeMounts: - name: containers mountPath: /var/lib/docker/containers readOnly: true - name: pods mountPath: /var/log/pods readOnly: true - name: random mountPath: /var/log/random readOnly: trueThe following example demonstrates adding a new collection source named new_example and removing the existing collection source random:
yamlloki-stack: namespace: loki promtail: defaultVolumes: - name: containers hostPath: path: /var/lib/docker/containers - name: pods hostPath: path: /var/log/pods - name: new_example hostPath: path: /var/tem/my-application defaultVolumeMounts: - name: containers mountPath: /var/lib/docker/containers readOnly: true - name: pods mountPath: /var/log/pods readOnly: true - name: new_example mountPath: /var/tem/my-application readOnly: trueConfigure custom alerting trigger rules for log alerting.
When configuring log alerting rules, follow the format in the example for the rules to take effect. If the configuration format is incorrect, the rules cannot be properly detected by the component, and the ineffective alerting rules will not be visible on the log configuration page. To create a new alerting rule, you must fully configure a sub-item of alerting_groups. When creating alert details, follow the indentation structure below. The configuration items include:
name: The name of the alerting rule.
rules: The details of the alerting rule.
- alerts: The rule name, which must be consistent with name.
- expr: The alerting rule expression. If invalid, the configuration will not take effect. For the alerting rule expression configuration specification, see official alerting rule expression configuration documentation.
- for: The alert duration.
- labels: The labels of the alerting rule, in key:value format.
- annotations: The annotations of the alerting rule, in key:value format. The value must be a string.
yamlloki-stack: loki: alerting_groups: - name: GenericHighErrorRate rules: - alert: GenericHighErrorRate expr: | sum by (job, instance) (rate({job=~".+"} |= "error" [5m])) > 0 for: 5m labels: severity: critical loki: logging/k8s.io annotations: summary: "High error rate detected in {{ $labels.job }} instance {{ $labels.instance }}" description: "Job {{ $labels.job }} on instance {{ $labels.instance }} has a high rate of error logs." - name: GenericExceptionDetected rules: - alert: GenericExceptionDetected expr: | sum by (job, instance) (rate({job=~".+"} |= "Exception" [5m])) > 0 for: 5m labels: severity: warning loki: logging/k8s.io annotations: summary: "Exception detected in {{ $labels.job }} instance {{ $labels.instance }}" description: "Job {{ $labels.job }} on instance {{ $labels.instance }} has logs containing 'Exception'." - name: GenericLogVolumeSpike rules: - alert: GenericLogVolumeSpike expr: | sum by (job, instance) (rate({job=~".+"}[5m])) > 1 for: 5m labels: severity: warning loki: logging/k8s.io annotations: summary: "Log volume spike detected in {{ $labels.job }} instance {{ $labels.instance }}" description: "Job {{ $labels.job }} on instance {{ $labels.instance }} has a spike in log volume." - name: GenericErrorRateThresholdExceeded rules: - alert: GenericErrorRateThresholdExceeded expr: | (sum by (job, instance) (rate({job=~".+"} |= "error" [5m])) / sum by (job, instance) (rate({job=~".+"}[5m]))) > 0.05 for: 5m labels: severity: critical loki: logging/k8s.io annotations: summary: "High error rate threshold exceeded in {{ $labels.job }} instance {{ $labels.instance }}" description: "Job {{ $labels.job }} on instance {{ $labels.instance }} has an error rate exceeding the threshold." - name: GenericServiceUnavailable rules: - alert: GenericServiceUnavailable expr: | sum by (job, instance) (rate({job=~".+"} |= "service unavailable" [5m])) > 0 for: 5m labels: severity: critical loki: logging/k8s.io annotations: summary: "Service unavailable detected in {{ $labels.job }} instance {{ $labels.instance }}" description: "Job {{ $labels.job }} on instance {{ $labels.instance }} has logs indicating 'service unavailable'." - name: GenericApplicationStartupFailure rules: - alert: GenericApplicationStartupFailure expr: | sum by (job, instance) (rate({job=~".+"} |= "startup failure" [5m])) > 0 for: 5m labels: severity: critical loki: logging/k8s.io annotations: summary: "Application startup failure detected in {{ $labels.job }} instance {{ $labels.instance }}" description: "Job {{ $labels.job }} on instance {{ $labels.instance }} has logs indicating 'startup failure'."
How to configure your application.
5.1 Kubernetes native applications.
When a native Kubernetes application prints logs, for the containerd container runtime environment, logs are printed to the default path:
/var/log/pods/{namespace}_{pod_name}_{pod_id}/{container_name}/0.log. In this case, you do not need to modify any log printing settings. The log collection system will automatically capture logs from this path and store them in the log storage component.5.2 User-defined applications.
User-defined applications print logs within their containers, with a specific log printing path. You need to map this in-container path to a hostPath on the host machine. This hostPath represents the location where the user-defined application prints logs. Configure this hostPath in the log collection source configuration as described in step 3 to enable collection of this path. After installation and deployment, configure the file name and application task name for this path in the collection task configuration.
 volumeMounts:
 - name: log-volume
   mountPath: /var/log
 volumes:
 - name: log-volume
  hostPath:
    path: /var/log/xxxx/xxxx
Using the Log Query Function
Prerequisites
Loki and Loki-Promtail have been deployed and configured, and the log collection and storage services are running properly.
Context
The log query system can help you quickly locate issues, monitor the system running state, and rectify faults. By filtering logs with labels, keywords, time ranges, and other criteria, you can extract the desired content from massive log data, accelerating issue identification and analysis.
Restrictions
The log query system may restrict the query complexity and data volume to prevent excessive occupation of system resources. Frequent or complex queries may be restricted.
Procedure
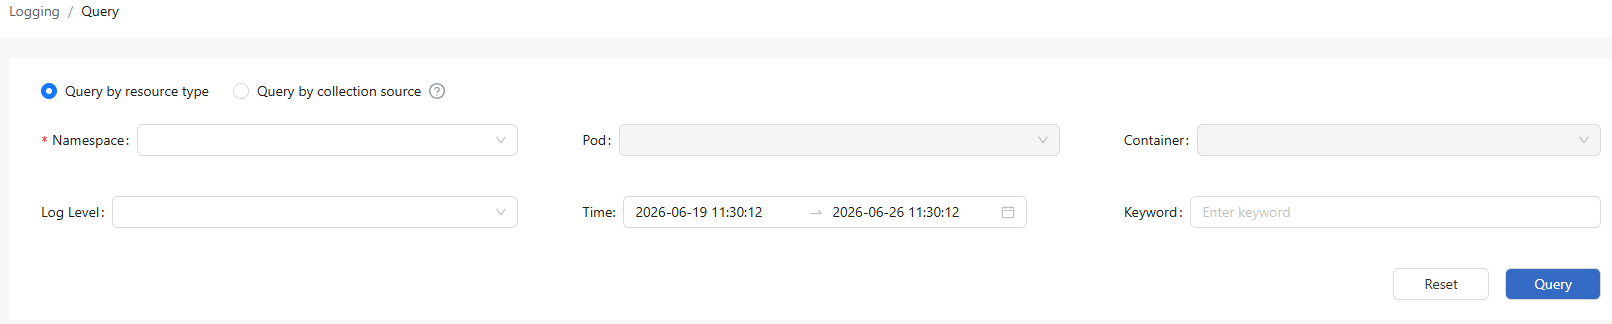
In the left navigation pane of the openFuyao platform, choose Observation Center > Logs > Log Query. The Log Query page is displayed.
Figure 3 Log query
Query logs by resource type:
Note:
The Loki component in the log component has a limit on the number of concurrent requests to prevent excessive concurrent requests to the query API.2.1 On the Log Query page, select Query by resource type. You can query logs by the namespace (mandatory), pod, or container.
2.2 Select a log level from the Log level drop-down list. The options include error, warning, info, debug, and critical.
2.3 Click the Time selector to select the time range.
2.4 Click the Keyword text box and enter a keyword for fuzzy search.
2.5 Click Query to query the logs of a specified resource type.
Query logs by collection source:
3.1 On the Log Query page, select Query by collection source. Enter a file name (mandatory) for the query.
Figure 3 Query by collection source

3.2 Click Log level to select the log level. The options include error, warning, info, debug, and critical.
3.3 Click the Time selector to select the time range.
3.4 Click the Keyword text box and enter a keyword for fuzzy search.
3.5 Click Query to query the logs of a specified resource type.
Using the Log Configuration Function
In the left navigation pane of the openFuyao platform, choose Observation Center > Logs > Log Configuration. On the Log Configuration page that is displayed, you can select different tabs to view the collection sources, collection tasks, and alert rules.
Creating a Collection Task
Prerequisites
- Loki and Loki-Promtail have been deployed and configured, and the log collection and storage services are running properly.
- The directory for logs to be collected has been created on the host machine, and Promtail must have permission to read the logs.
Context
A log collection task uses Loki-Promtail to collect logs and push them to Loki for real-time monitoring, storage, and analysis. After a collection task is created, log files in different paths can be monitored for subsequent queries and alerting.
Restrictions
- The collection path must be a specific file or directory to prevent a large number of irrelevant files from being collected, which could impact system performance.
- Large-scale collection tasks may consume significant resources. You are advised to assign appropriate priorities and frequencies to collection tasks.
Procedure
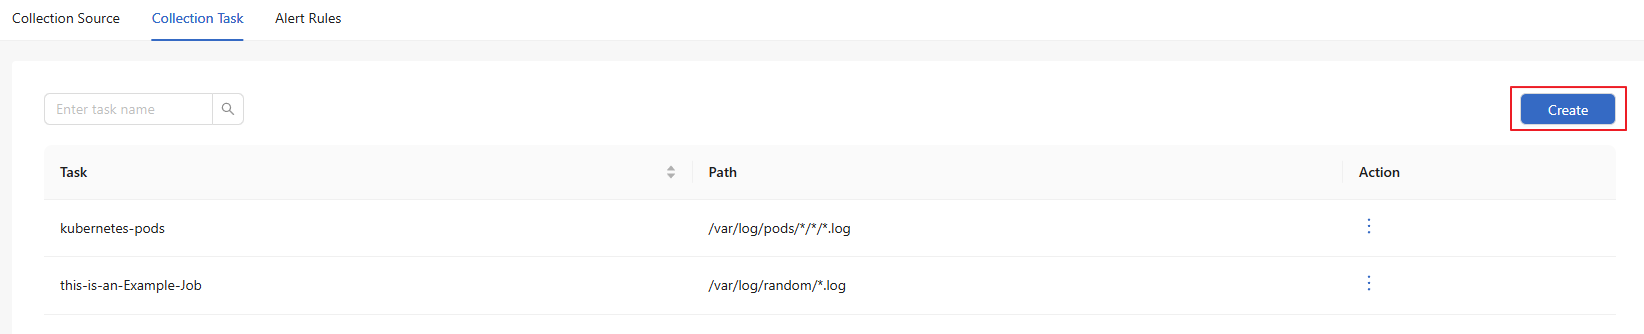
- In the Collection Jobs tab, click Create. The Create Collection Job dialog box is displayed.
Figure 4 Collection task creation page
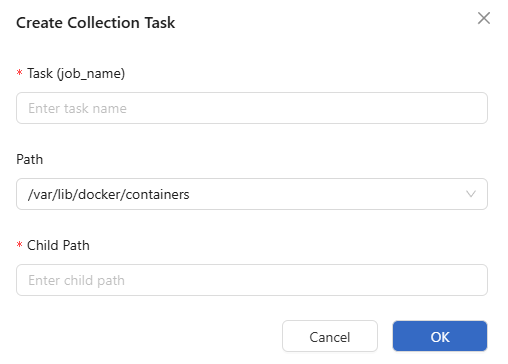
Enter the collection task name.
Select the collection source path.
Figure 5 Creating a collection task
Click OK.
Related Operations
You can click  in the Operation column on the list page to modify or remove a collection task as required.
Follow-up Operations
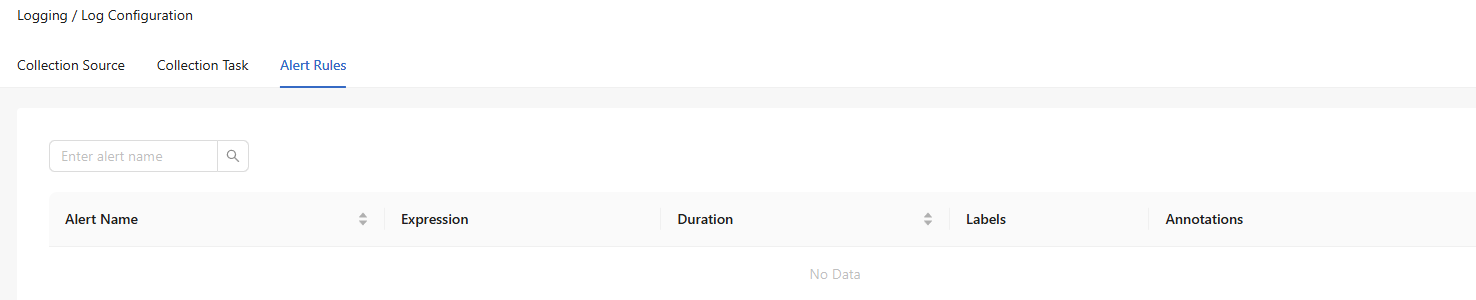
In the Alert Rules tab, view details about the alert rules.
Figure 6 Alert rules
Licensed under the MulanPSL2
 YueGongWangAnBei No.44030002007300