NUMA-aware Scheduling Development Guide
Introduction
The non-uniform memory access (NUMA) architecture has become increasingly prevalent in modern high-performance computing and large-scale distributed systems. In this architecture, memory is allocated to multiple nodes (NUMA nodes), each with its own local memory and CPUs. This design helps reduce memory access latency and improves system performance. However, the complexity of the NUMA architecture also introduces challenges in system resource management, especially in multi-task and multi-threaded environments. To fully leverage the benefits of the NUMA architecture, refined management and monitoring of system resources are essential. Through an intuitive graphical interface, visualized NUMA resource monitoring provides real-time insights into the allocation and utilization of NUMA resources. This enables users to better understand and manage these resources, improving system performance and resource utilization. In containerized clusters, resource scheduling is typically handled by various schedulers. NUMA-aware scheduling employs tailored optimization methods for tasks with high, medium, and low priorities. It ensures optimal pod allocation through cluster-level and intra-node NUMA scheduling, boosting system performance. For details, see NUMA-aware Scheduling.
Restrictions
-
To enable this feature, modify the kubelet configuration file by performing the following steps. These steps will be automatically performed when the NUMA affinity policy or the optimal NUMA distance policy is enabled.
-
Open the configuration file of kubelet.
vi /var/lib/kubelet/config.yaml -
Add or modify the configuration items.
cpuManagerPolicy:static
topologyManagerPolicy:xxx -
Apply the modifications.
rm -rf /var/lib/kubelet/cpu_manager_state
systemctl daemon-reload
systemctl restart kubelet -
Check the status of kubelet.
systemctl status kubeletThe Running state indicates success.
 NOTE
NOTE
Modifying the topology policy of a node will restart kubelet, which may cause some pods to be rescheduled. Proceed with caution in production environments.
-
-
To enable the NUMA-Fast feature, you need to modify the system configuration in advance. The procedure is as follows:
-
Modify the kernel command line parameters of the operating system (OS).
vim /etc/grub2-efi.cfgLocate the line starting with Linux that corresponds to the current OS image and append the following container runtime parameters.
mem_sampling_on numa_icon=enableThe following is an example:
linux /vmlinuz-5.10.0-216.0.0.115.oe2203sp4.aarch64 root=/dev/mapper/openeuler-root ro rd.lvm.lv=openeuler/root rd.lvm.lv=openeuler/swap video=VGA-1:640x480-32@60me cgroup_disable=files apparmor=0 crashkernel=1024M,high smmu.bypassdev=0x1000:0x17 smmu.bypassdev=0x1000:0x15 arm64.nopauth console=tty0 kpti=off mem_sampling_on numa_icon=enable -
Modify the configuration file of containerd.
vi /etc/containerd/config.tomlModify the content as follows:
[plugins."io.containerd.nri.v1.nri"]
disable = false
Restart containerd to apply the update.
systemctl restart containerd
-
Currently, the NUMA-Fast feature is supported only in environments running openEuler 22.03 LTS SP4 in the Arm architecture. This feature has a lower priority than CPU pinning. It will be automatically disabled if there are pods with CPU pinning in the cluster.
-
To enable the cluster-level NUMA monitoring feature, you need to configure Prometheus in advance.
-
For details about how to connect Prometheus Operator to NUMA Exporter, see Task Scenario 2.
-
For details about how to connect Prometheus to NUMA Exporter, see Task Scenario 3.
-
Environment Preparation
Environment Requirements
- Kubernetes 1.21 or later has been deployed.
- Prometheus has been deployed.
- containerd 1.7 or later has been deployed.
Environment Deployment
For details, see NUMA-aware Scheduling User Guide.
Environment Verification
Take Volcano as an example. If the status of all pods in the volcano-system namespace is Running, the environment is successfully set up.
volcano-system volcano-admission-xx-xx           1/1  Running  0  xmxxs
volcano-system volcano-admission-init-xx         1/1  Running  0  xmxxs
volcano-system volcano-controllers-xx-xx         1/1  Running  0  xmxxs
volcano-system volcano-schedulers-xx-xx          1/1  Running  0  xmxxs
volcano-system volcano-exporter-daemonset-xx     n/n  Running  0  xmxxs
volcano-system volcano-config-website-xx-xx      1/1  Running  0  xmxxs
volcano-system volcano-config-xx-xx              1/1  Running  0  xmxxs
volcano-system numa-exporter-xx                  n/n  Running  0  xmxxs
default        numaadj-xx	                      n/n  Running  0  xmxxs
Task Scenario 1: Modifying a Scheduling Policy in Volcano
Scenario Overview
Configure the scheduling policy in Volcano.
System Architecture
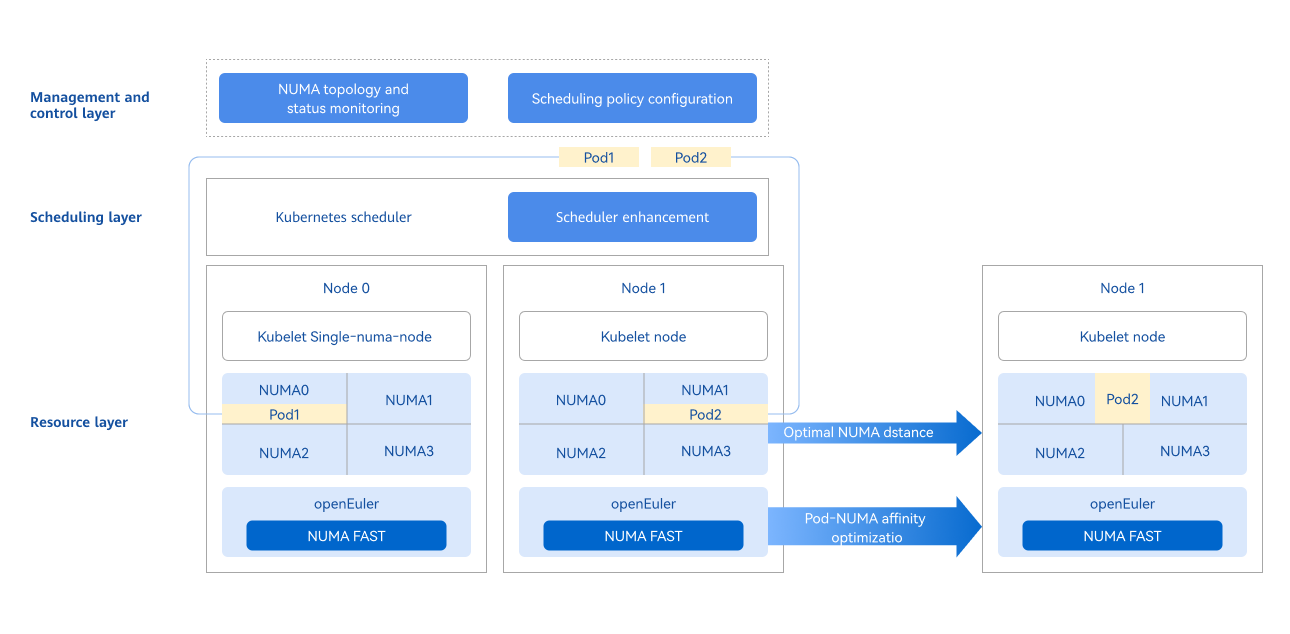
The management and control layer leverages the openFuyao platform's console-website capabilities to provide a frontend interface for NUMA topology visualization, status monitoring, and scheduling policy configuration. In a cluster, both Kubernetes schedulers and user-defined schedulers are supported. A scheduler works with the kubelet to schedule resources to nodes. When pods are running, the NUMA FAST capability is used to optimize pod affinity scheduling. Pods with strong network affinity are scheduled to the same NUMA node, improving overall performance and delivering an end-to-end optimized scheduling solution.
Figure 1 NUMA-aware scheduling architecture
API Description (Taking numa-aware as an Example)
Table 1 Main APIs
| API | Description |
|---|---|
| GET /rest/scheduling/v1/numaaware | Query the NUMA-aware scheduling policy. |
| PUT /rest/scheduling/v1/numaaware | Modify the NUMA-aware scheduling policy. |
Development Procedure
Check the configuration file to verify whether the numa-aware plug-in is available. In addition, you can modify the configuration file to enable or disable the NUMA-aware extended scheduling policy. The core code is as follows:
func methodPut(clientset kubernetes.Interface, plugin string, status string) (*httputil.ResponseJson, int) {
    // Obtain the configuration file of Volcano.
    configmap, err := k8sutil.GetConfigMap(clientset, constant.VolcanoConfigServiceConfigmap,
       constant.VolcanoConfigServiceDefaultNamespace)
    if err != nil {
       zlog.Errorf("GetConfigMap failed, %v", err)
       return httputil.GetDefaultServerFailureResponseJson(), http.StatusInternalServerError
    }

	// Obtain specific content of the configuration file.
    configContent, exists := configmap.Data[constant.VolcanoConfigServiceConfigmapName]
    zlog.Infof("configContent: %v", configContent)
    if !exists {
       zlog.Errorf("GetConfigMap failed, content is empty")
       return httputil.GetDefaultServerFailureResponseJson(), http.StatusInternalServerError
    }

	// Modify the policy status.
    str := "name: " + plugin
    if status == "open" {
       if !strings.Contains(configContent, str) {
          configContent = insertPlugin(configContent)
       }
    } else if status == "close" {
       if strings.Contains(configContent, str) {
          configContent = removePlugin(configContent, plugin)
       }
    } else {
       zlog.Errorf("status is not open or close, %v", err)
       return httputil.GetDefaultServerFailureResponseJson(), http.StatusInternalServerError
    }

	// Update the configuration file.
    configmap.Data[constant.VolcanoConfigServiceConfigmapName] = configContent
    configmap, err = k8sutil.UpdateConfigMap(clientset, configmap)
    if err != nil {
       zlog.Errorf("UpdateConfigMap failed, %v", err)
       return httputil.GetDefaultServerFailureResponseJson(), http.StatusInternalServerError
    }

	//  Restart the scheduler.
    err = k8sutil.DeleteVolcanoPod(clientset, constant.VolcanoConfigServiceDefaultNamespace)
    if err != nil {
       zlog.Errorf("delete pod volcano-scheduler failed, %v", err)
       return httputil.GetDefaultServerFailureResponseJson(), http.StatusInternalServerError
    }

    return &httputil.ResponseJson{
       Code: constant.Success,
       Msg:  "success",
    }, http.StatusOK
}
Debugging and Verification
Call the API corresponding to this task scenario to check whether the scheduling policy can be viewed or modified.
-
Call the API. Change ClusterIP in the service to NodePort and use the NodePort value to access the API.
curl -X GET "http://192.168.100.59:NodePort/rest/scheduling/v1/numaaware" -
View the Volcano configuration file in the cluster.
kubectl edit configmaps volcano-scheduler-configmap -n volcano-systemCheck whether the file contains the - numa-aware entry. If so, the NUMA-aware scheduling policy is enabled.
-
Check whether the scheduling policy takes effect.
Create a Deployment with the affinity policy set to single-numa-node, use Volcano as the scheduler, and check whether the scheduling is performed as expected.
apiVersion: apps/v1
kind: Deployment
metadata:
  name: nginx
spec:
  replicas: 1
  selector:
    matchLabels:
      app: nginx
  template:
    metadata:
      labels:
        app: nginx
      annotations:
        # Specify the NUMA affinity.
        volcano.sh/numa-topology-policy: single-numa-node
    spec:
      # Specify Volcano as the scheduler.
      schedulerName: volcano
      containers:
      - name: nginx
        image: nginx
        imagePullPolicy: IfNotPresent
        resources:
          limits:
            cpu: 1
            memory: 100Mi
          requests:
            cpu: 1
            memory: 100Mi
Task Scenario 2: Connecting Prometheus Operator to NUMA Exporter
Scenario Overview
Prometheus Operator uses custom resource definitions (CRDs) to manage Prometheus configurations, including Prometheus, AlertManager, ServiceMonitor, and PodMonitor. ServiceMonitor defines how Prometheus discovers and scrapes monitoring data of specific services. It specifies one or more Kubernetes services as scrape targets for Prometheus.
Development Procedure
-
Edit the YAML file of ServiceMonitor.
Create a YAML file named numaExporter-serviceMonitor.yaml. The file content is as follows:
   apiVersion: monitoring.coreos.com/v1
   kind: ServiceMonitor
   metadata:
     labels:
       name: numa-exporter
     name: numa-exporter
     namespace: volcano-system
   spec:
     endpoints:
       - interval: 30s
         port: https
     selector:
       matchLabels:
         app: numa-exporter
     namespaceSelector:
       matchNames:
- volcano-system -
Apply ServiceMonitor resources so that Prometheus can discover NUMA Exporter and scrape monitoring data.
Run the following kubectl command to apply ServiceMonitor resources to the Kubernetes cluster.
kubectl apply -f numaExporter-serviceMonitor.yaml
Debugging and Verification
-
Log in to Prometheus.
To access the Prometheus page, enter http://prometheus-server:9090 in the address box of a browser.
NOTE
If Prometheus is configured with authentication or other security settings, enter the required credentials. -
Verify the monitored objects.
2.1 Check Prometheus targets.
On the Prometheus web page, navigate to the Targets page (usually found under the Status menu) and check whether the numa-exporter monitored objects have been correctly discovered and scraped.
2.2 View the data.
Enter numa_node_cpus_count in the search box to obtain the metric data.
Task Scenario 3: Connecting Prometheus to NUMA Exporter
Scenario Overview
In a Kubernetes cluster, a ConfigMap is used to manage and update the Prometheus configuration file (prometheus.yml).
Development Procedure
-
Edit the ConfigMap.
Run the following command to find the ConfigMap that stores prometheus.yml:
kubectl get configmap -n monitoringUse the editor to open and modify the ConfigMap.
kubectl edit configmap <prometheus-config-name> -n monitoringIn the editor, add or modify the scrape_configs section.
scrape_configs:
- job_name: 'numa-exporter'
 static_configs:
- targets: ['numa-exporter.volcano-system:9201'] -
Reload the Prometheus configuration.
Save and exit the editor, and hot-reload Prometheus to apply the changes.
curl -X POST http://prometheus-server:9090/-/reload # Replace the fields in the URL with the actual hostname or IP address and port number where Prometheus is running.
Debugging and Verification
-
Log in to Prometheus.
To access the Prometheus page, enter http://prometheus-server:9090 in the address box of a browser.
NOTE
If Prometheus is configured with authentication or other security settings, enter the required credentials. -
Verify the monitored objects.
-
Check Prometheus targets: On the Prometheus web page, navigate to the Targets page (usually found under the Status menu) and check whether the numa-exporter monitored objects have been correctly discovered and scraped.
-
View the data: Enter numa_node_cpus_count in the search box to obtain the metric data.
-
Task Scenario 4: Scheduling Non-Exclusive Pods to the Same NUMA Node Based on Affinity
Scenario Overview
Pods with significant network communication with each other can be treated as a group of related pods. Scheduling this group of related pods to the same NUMA node can effectively reduce cross-NUMA access, thereby improving system throughput.
System Architecture
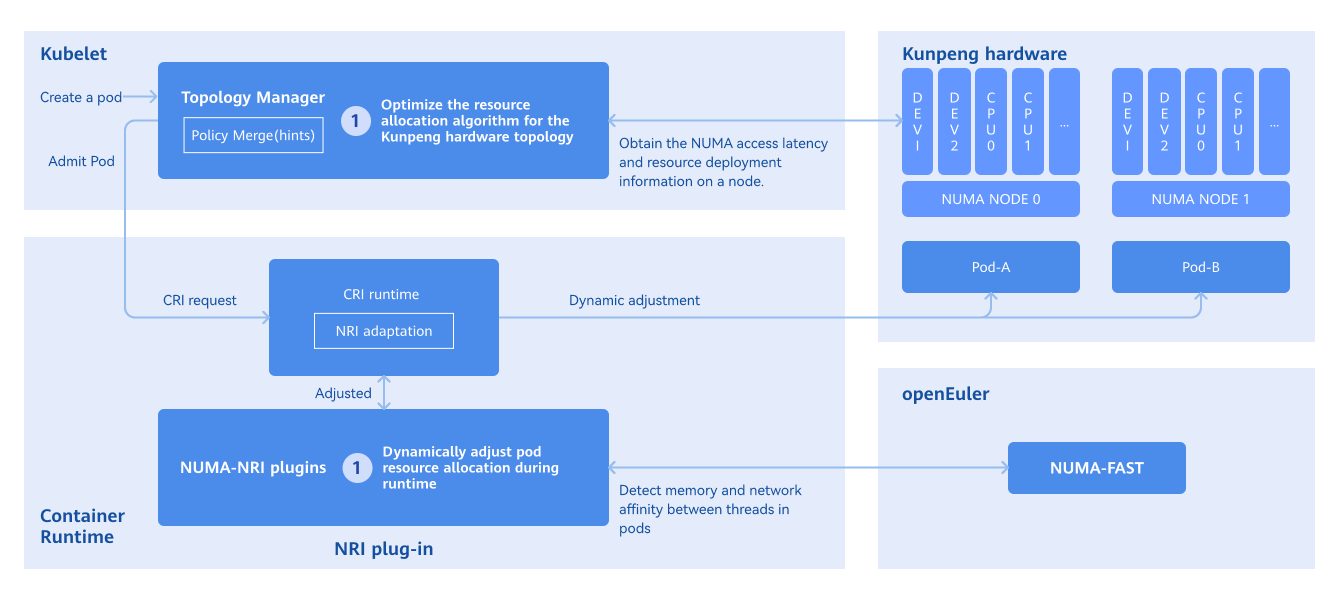
- Obtaining pod affinity: The NUMA-FAST module of the OS is used to collect statistics on thread affinity and convert the statistics into pod affinity.
- Optimizing runtime affinity: The node resource interface (NRI) is used to perceive resource awareness and store inter-pod affinity. When a pod is created, cpuset/memset of the pod is modified so that pods with affinity are allocated to the same NUMA node. The following figure shows the principles behind pod affinity scheduling.
Figure 2 Principles of pod affinity scheduling
Development Procedure
Run the following command to view the affinity relationship between pods:
kubectl get oenuma podafi -n tcs -o yaml
In the spec.node.numa field, you can view the affinity relationship between pods.
Debugging and Verification
Check whether pods with thread affinity are scheduled to the same NUMA node before and after the deployment.
-
Run the following command to query the thread ID. NGINX is used as an example.
ps -ef | grep nginx -
Run the following command to obtain the PID:
cat /proc/#pid/status
Check the Cpus_allowed field. If it shows that the pods have been scheduled to a single NUMA node, then CPU pinning for affinity pods has been successfully applied.
FAQ
What can I do if the NUMA affinity policy does not take effect?
-
Symptom
A workload is configured with the NUMA affinity policy single-numa-node and scheduled with Volcano, but it fails to be scheduled to a node whose topology policy is also single-numa-node.
-
Possible Causes
- The numa-aware plug-in is not enabled in the configuration file.
- The workload is configured with anti-affinity or taints. As a result, the workload cannot be scheduled to the node.
- Node resources are fully utilized.
-
Solution
Enable the numa-aware plug-in, check whether anti-affinity is configured, and free up resources on the node.