Log Extension Development Guide
Feature Overview
As a pluggable extension, the logging system is independently deployed and runs on the openFuyao platform. It provides powerful features such as log filtering, search, query, and alerting for both the platform and its users.
Restrictions
None.
Environment Preparation
For details about the installation procedure, see Installation Guide.
Usage Scenario
Usage Scenario Overview
Developers need to install the log extension on the openFuyao cluster management plane. During installation, several options must be configured to ensure that the logging system is well-adapted to specific service scenarios. The configurable options are as follows:
- The time range for collecting logs (which is calculated since their creation) and the policy for updating stored logs
- The log collection source
- Custom alerting rules for log-based alerting
System Architecture
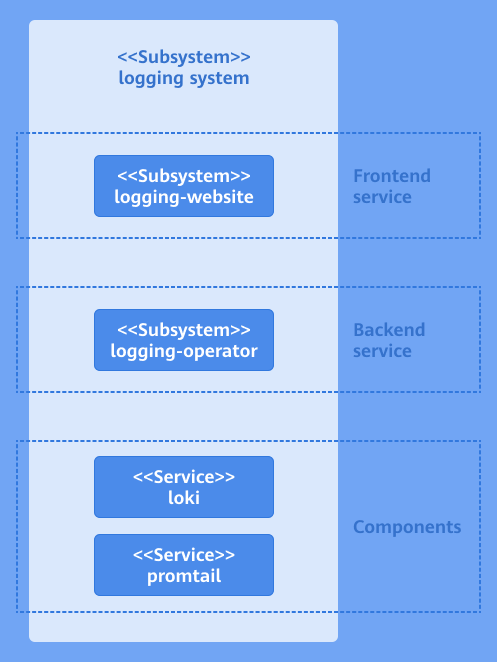
The service layer of the logging system consists of the user interface (UI) layer, backend layer, and component layer.
-
UI layer: You can perform log operations on the console website.
-
Backend layer: The logging-operator is deployed as a microservice to provide core capabilities, including log filtering, search, query, configuration, and alerting.
-
Component layer: This layer provides critical capabilities for the logging system, including log collection, storage, and processing. It supports integration with the backend layer, enabling users to efficiently perform log operations.
Figure 1 System architecture of the log extension
API Description
The following table describes the main APIs.
Table 1 Main APIs
| API | Description |
|---|---|
| PATCH /rest/logging/v1/update-config | Adds new collection jobs or modifies existing ones. |
| GET /rest/logging/v1/configmap | Lists the collection source paths of all workflows of the current log collection component. |
Development Procedure
Deployment on the openFuyao Platform
-
Install the log extension.
1.1 Log in to the openFuyao platform. The Summary page is displayed by default. In the left navigation pane, choose Application Market > Applications. The Applications page is displayed.
1.2 Enter logging-package in the search box to find the logging-package application card.
1.3 Click the application card. The application details page is displayed. On the details page, click Deploy in the upper-right corner.
1.4 In the Installation Information area on the deployment page, set the application name, version information, and namespace. Set the namespace to default.
Figure 2 Installation Information

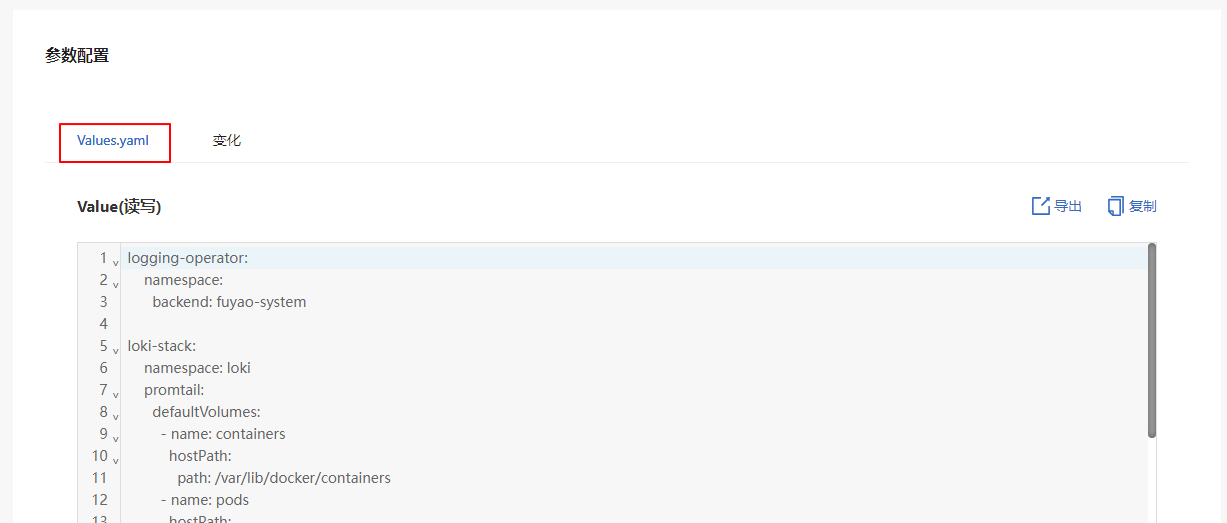
1.5 In the Parameter Configuration area, you can view the configuration of each configurable field on the preview page of Values.yaml.
Figure 3 YAML configuration
1.6 Click OK.
Standalone Deployment
-
Install the log extension.
1.1 Obtain the logging-package Helm package.
wget https://harbor.openfuyao.com/chartrepo/openfuyao-catalog/charts/logging-package-0.13.0.tgz1.2 Enter the values to be deployed in Values.yaml.
1.3 Deploy the extension using Helm.
tar -zxf logging-package-0.13.0.tgz
helm install logging -n default ./logging-package
1.4 Verify the installation and access.
-
Ensure that the logging package has been successfully deployed.
kubectl get pods -n default
kubectl get pods -n openfuyao-system
kubectl get pods -n loki -
Ensure that the service is exposed.
kubectl get svc -n default | grep logging -
Access the logging-website page.
http://<Node_IP>:<logging.service.nodePort>
-
-
The time range for collecting logs (which is calculated since their creation) and the policy for updating stored logs
-
reject_old_samples_max_age: This field specifies the maximum time span (from the time of log creation to the time of the current event) for log collection supported by the log collector, which is set to 168 hours (default configuration). This means that logs created more than seven days ago will not be collected by the log collection component.
-
retention_deletes_enabled: This field determines whether the automatic deletion of old logs is enabled. By default, it is set to false. This means that collected logs will be stored indefinitely without applying the policy for automatic deletion of old logs.
-
retention_period: This field takes effect only when retention_deletes_enabled is set to true. It defines the duration after which collected logs will be cleared from storage once they exceed the specified time threshold.
loki-stack:
  loki:
    config:
      limits_config:
        reject_old_samples_max_age: 168h
      table_manager:
        retention_deletes_enabled: false
retention_period: 0s -
-
The log collection source
This configuration defines the detailed log collection source and specifies the root directory of the collector. You need to set both defaultVolumes and defaultVolumeMounts. Ensure that the values of path and mountpath are the same. The collection source path must be a readable path. If the path is unreadable, the configuration does not take effect.
 NOTE
NOTE
After the collection source configuration takes effect, it cannot be modified.The following information needs to be configured:
loki-stack:
  namespace: loki
  promtail:
    defaultVolumes:
      - name: containers
        hostPath:
          path: /var/lib/docker/containers
      - name: pods
        hostPath:
          path: /var/log/pods
      - name: random
        hostPath:
          path: /var/log/random

    defaultVolumeMounts:
      - name: containers
        mountPath: /var/lib/docker/containers
        readOnly: true
      - name: pods
        mountPath: /var/log/pods
        readOnly: true
      - name: random
        mountPath: /var/log/random
        readOnly: true
The following is an example of adding a collection source named new_example and deleting the existing collection source named random.
loki-stack:
  namespace: loki
  promtail:
    defaultVolumes:
      - name: containers
        hostPath:
          path: /var/lib/docker/containers
      - name: pods
        hostPath:
          path: /var/log/pods
      - name: new_example
        hostPath:
          path: /var/tem/my-application

    defaultVolumeMounts:
      - name: containers
        mountPath: /var/lib/docker/containers
        readOnly: true
      - name: pods
        mountPath: /var/log/pods
        readOnly: true
      - name: new_example
        mountPath: /var/tem/my-application
readOnly: true -
Custom alerting rules for log-based alerting
When configuring log-based alerting rules, follow the format in the following example. If the format is incorrect, the log-based alerting rules cannot be detected by components. On the Log Configuration page, you cannot view the alerting rules that do not take effect. To create an alerting rule, you need to configure a complete subitem of alerting_groups. When creating alert details, comply with the following indentation structure. The configuration items are as follows:
- name: Alerting rule name.
- rules: Alerting rule details.
- alerts: Rule name, which must be the same as the value of name.
- expr: Alerting rule expression. If the expression is invalid, the configuration does not take effect. For details about how to configure the alert rule expression, see Alerting rules.
- for: Alert duration.
- labels: The label of the alerting rule, in a key:value format.
- annotations: Annotations for the alerting rule, in a key:value format. The value must be provided as a string.
loki-stack:
  loki:
    alerting_groups:
      - name: GenericHighErrorRate
        rules:
          - alert: GenericHighErrorRate
            expr: |
              sum by (job, instance) (rate({job=~".+"} |= "error" [5m])) > 0
            for: 5m
            labels:
              severity: critical
              loki: logging/k8s.io
            annotations:
              summary: "High error rate detected in {{ $labels.job }} instance {{ $labels.instance }}"
              description: "Job {{ $labels.job }} on instance {{ $labels.instance }} has a high rate of error logs."


      - name: GenericExceptionDetected
        rules:
          - alert: GenericExceptionDetected
            expr: |
              sum by (job, instance) (rate({job=~".+"} |= "Exception" [5m])) > 0
            for: 5m
            labels:
              severity: warning
              loki: logging/k8s.io
            annotations:
              summary: "Exception detected in {{ $labels.job }} instance {{ $labels.instance }}"
              description: "Job {{ $labels.job }} on instance {{ $labels.instance }} has logs containing 'Exception'."

      - name: GenericLogVolumeSpike
        rules:
          - alert: GenericLogVolumeSpike
            expr: |
              sum by (job, instance) (rate({job=~".+"}[5m])) > 1
            for: 5m
            labels:
              severity: warning
              loki: logging/k8s.io
            annotations:
              summary: "Log volume spike detected in {{ $labels.job }} instance {{ $labels.instance }}"
              description: "Job {{ $labels.job }} on instance {{ $labels.instance }} has a spike in log volume."

      - name: GenericErrorRateThresholdExceeded
        rules:
          - alert: GenericErrorRateThresholdExceeded
            expr: |
              (sum by (job, instance) (rate({job=~".+"} |= "error" [5m])) / sum by (job, instance) (rate({job=~".+"}[5m]))) > 0.05
            for: 5m
            labels:
              severity: critical
              loki: logging/k8s.io
            annotations:
              summary: "High error rate threshold exceeded in {{ $labels.job }} instance {{ $labels.instance }}"
              description: "Job {{ $labels.job }} on instance {{ $labels.instance }} has an error rate exceeding the threshold."
      - name: GenericServiceUnavailable
        rules:
          - alert: GenericServiceUnavailable
            expr: |
              sum by (job, instance) (rate({job=~".+"} |= "service unavailable" [5m])) > 0
            for: 5m
            labels:
              severity: critical
              loki: logging/k8s.io
            annotations:
              summary: "Service unavailable detected in {{ $labels.job }} instance {{ $labels.instance }}"
              description: "Job {{ $labels.job }} on instance {{ $labels.instance }} has logs indicating 'service unavailable'."
      - name: GenericApplicationStartupFailure
        rules:
          - alert: GenericApplicationStartupFailure
            expr: |
              sum by (job, instance) (rate({job=~".+"} |= "startup failure" [5m])) > 0
            for: 5m
            labels:
              severity: critical
              loki: logging/k8s.io
            annotations:
              summary: "Application startup failure detected in {{ $labels.job }} instance {{ $labels.instance }}"
description: "Job {{ $labels.job }} on instance {{ $labels.instance }} has logs indicating 'startup failure'." -
Configure your applications.
5.1 Kubernetes native applications
For Kubernetes native applications, when logs are printed in a container runtime environment like containerd, they are automatically printed to the default path:
/var/log/pods/{namespace}_{pod_name}_{pod_id}/{container_name}/0.log. In this case, you do not need to modify the log printing settings. The logging system automatically captures the logs from this path and saves them to the log storage component.5.2 User-defined applications
For user-defined applications that print logs inside containers, the logs will have a specific path within the containers. You need to map the path in the containers to the hostPath in the host machine. The hostPath indicates the location where the application logs are printed. Configure the hostPath based on the log collection source configured in step 3 to collect logs from the path. After the installation and deployment are complete, configure the file name and application task name in the path in the collection task configuration.
volumeMounts:
- name: log-volume mountPath: /var/log volumes:
- name: log-volume hostPath: path: /var/log/xxxx/xxxx
Debugging and Verification
If the configured collection task name and collection source path match the collection paths listed in the workflow of the current logging system, the configuration takes effect. The following table lists the APIs for viewing the collection source paths of all workflows of the current logging system.
Table 2 Debugging API description
| API | Description |
|---|---|
| GET /rest/logging/v1/configmap | Lists the collection source paths of all workflows of the current log collection component. |